Open access The Arrival of Siberian Ancestry Connecting the Eastern Baltic to Uralic Speakers further East, by Saag et al. Current Biology (2019).
Interesting excerpts:
In this study, we present new genomic data from Estonian Late Bronze Age stone-cist graves (1200–400 BC) (EstBA) and Pre-Roman Iron Age tarand cemeteries (800/500 BC–50 AD) (EstIA). The cultural background of stone-cist graves indicates strong connections both to the west and the east [20, 21]. The Iron Age (IA) tarands have been proposed to mirror “houses of the dead” found among Uralic peoples of the Volga-Kama region [22].
(…) The 33 individuals included 15 from EstBA, 6 from EstIA, 5 from Pre-Roman to Roman Iron Age Ingria (500 BC–450 AD) (IngIA), and 7 from Middle Age Estonia (1200–1600 AD) (EstMA) and yielded endogenous DNA ∼4%–88%, average genomic coverages ∼0.017–0.734×, and contamination estimates <4% (Table S1). We analyzed the data in the context of modern and other ancient individuals, including from Neolithic Estonia [13].
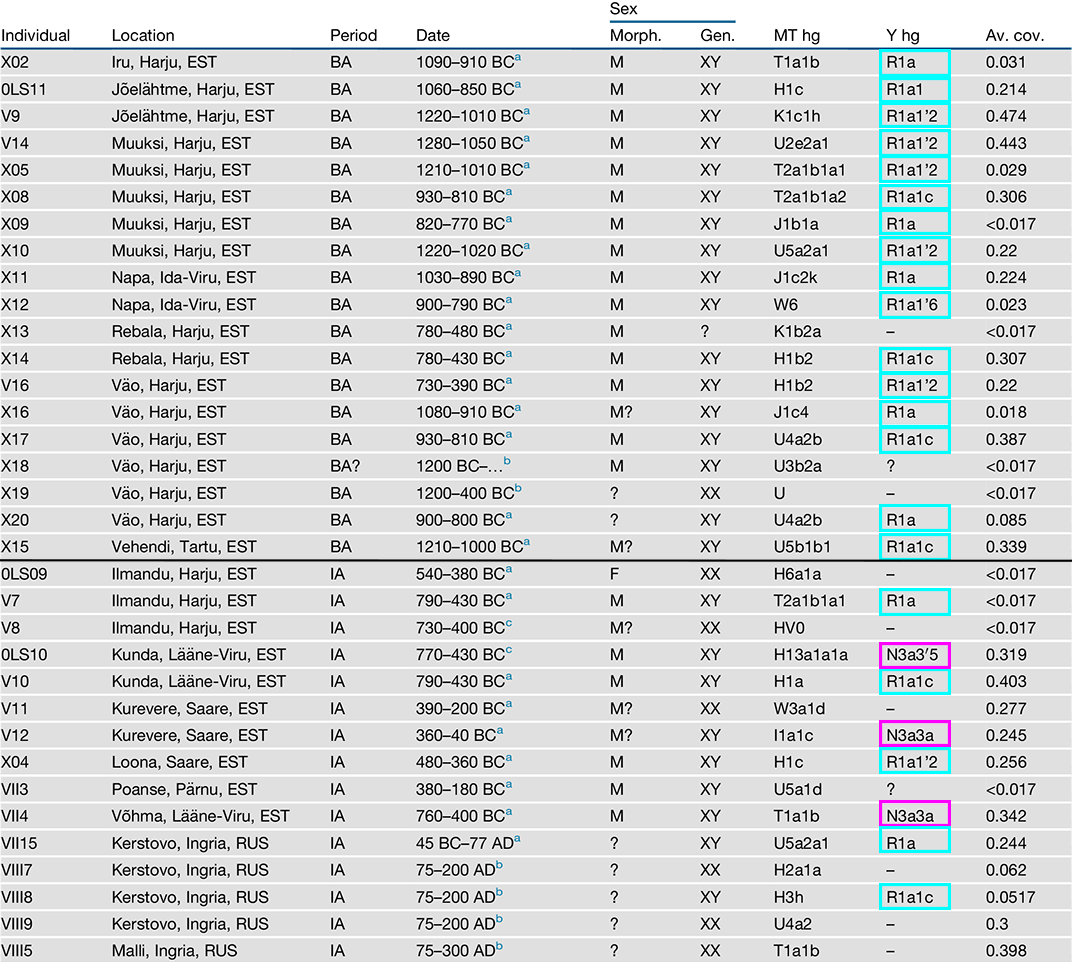
We identified chrY hgs for 30 male individuals (Tables 1 and S2; STAR Methods). All 16 successfully haplogrouped EstBA males belonged to hg R1a, showing no change from the CWC period, when this was also the only chrY lineage detected in the Eastern Baltic [11, 13, 30, 31]. Three EstIA and two IngIA individuals also belonged to hg R1a, but three EstIA males belonged to hg N3a, the earliest so far observed in the Eastern Baltic. Three EstMA individuals belonged to hg N3a, two to hg R1a, and one to hg J2b. ChrY lineages found in the Baltic Sea region before the CWC belong to hgs I, R1b, R1a5, and Q [10, 11, 12, 13, 17, 32]. Thus, it appears that these lineages were substantially replaced in the Eastern Baltic by hg R1a [10, 11, 12, 13], most likely through steppe migrations from the east [30, 31]. (…) Our results enable us to conclude that, although the expansion time for R1a1 and N3a3′5 in Eastern Europe is similar [25], hg N3a likely reached Estonia or at least became comparably frequent to modern Estonia [1] only during the BA-IA transition.
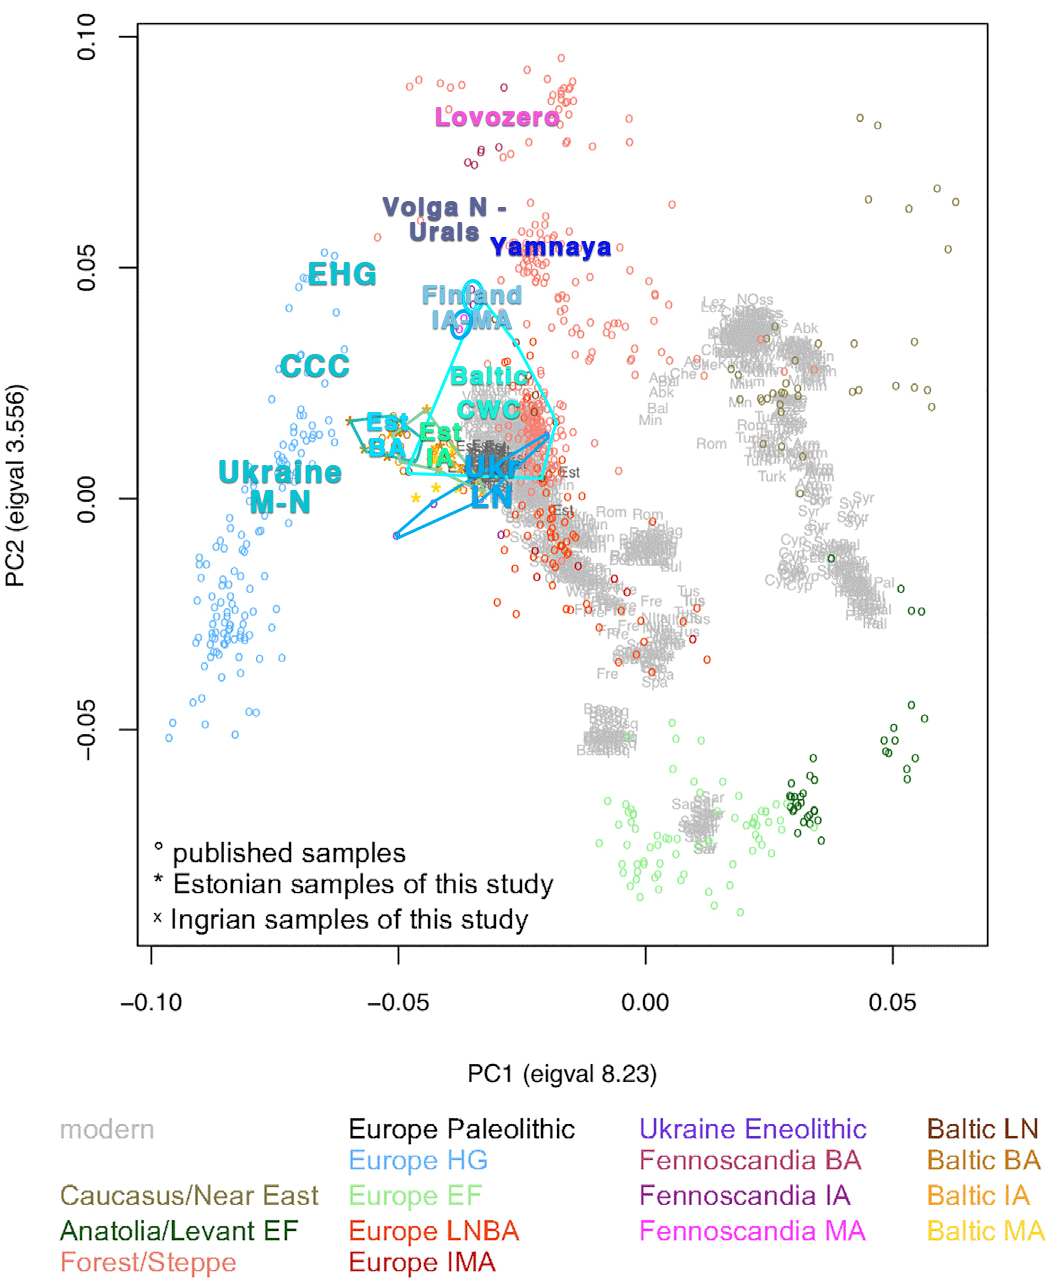
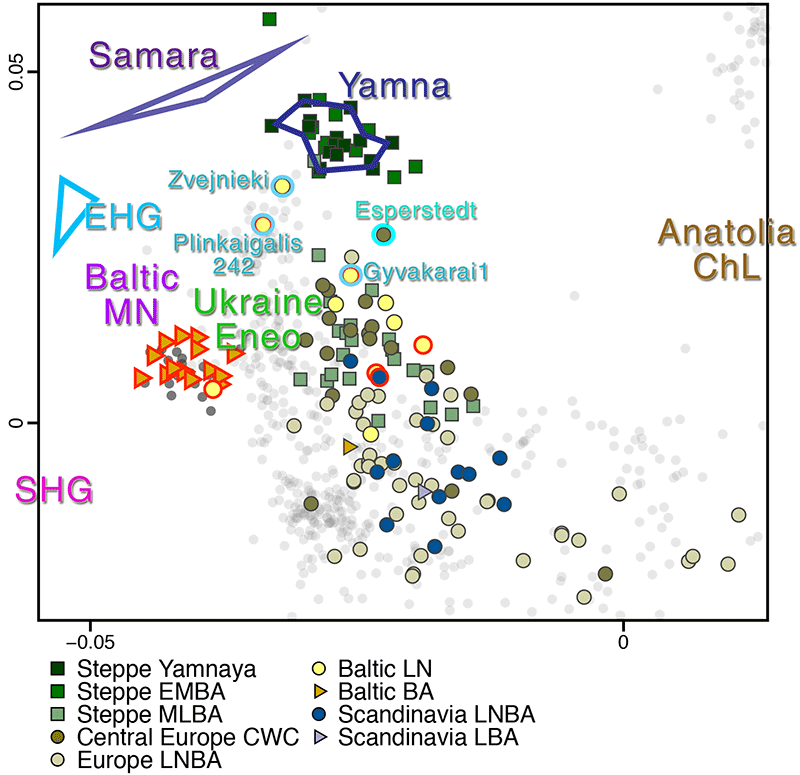
A clear shift toward West Eurasian hunter-gatherers is visible between European LN and BA (including Baltic CWC) and EstBA individuals, the latter clustering together with Latvian and Lithuanian BA individuals [11]. EstIA, IngIA, and EstMA individuals project between BA individuals and modern Estonians, partially overlapping with both.
(…) EstBA individuals are clearly distinguishable from Estonian CWC individuals as the former have more of the blue component most frequent in WHGs and less of the brown and yellow components maximized in Caucasus hunter-gatherers and modern Khanty, respectively. The individuals of EstBA, EstIA, IngIA, EstMA, and modern Estonia are quite similar to each other on average, indicating that the relatively high proportion of WHG ancestry in modern Eastern Baltic populations compared to other present-day Europeans [15] traces back to the BA.
When comparing Estonian CWC and EstBA using autosomal outgroup f3 and Patterson’s D statistics (Table S3), the latter is more similar to other Baltic BA populations, to Baltic IA and Middle Age (MA) populations, and also to populations similar to WHGs and Scandinavian hunter-gatherers (SHGs), but not to Estonian CCC (Figures 2A and S2A; Data S1). The increase in WHG or SHG ancestry could be connected to western influences seen in material culture [20, 21] and facilitated by a decline in local population after the CCC-CWC period [20]. A slight trend of bigger similarity of Estonian CWC to forest or steppe zone populations and of EstBA to European early farmer populations can also be seen.
(…) When comparing to modern populations, Estonian CWC is slightly more similar to Caucasus individuals but EstBA to Baltic populations and Finnic speakers (Figure 2B; Data S1). Outgroup f3 and D statistics do not reveal apparent differences when comparing EstBA to EstIA, EstIA to IngIA, and EstIA to EstMA (Data S1).
These results highlight how uniparental and autosomal data can lead to different demographic inferences—the genetic change between CWC and BA not seen in uniparental lineages is clear in autosomal data and the appearance of chrY hg N in the IA is not matched by a clear shift in autosomal profiles.
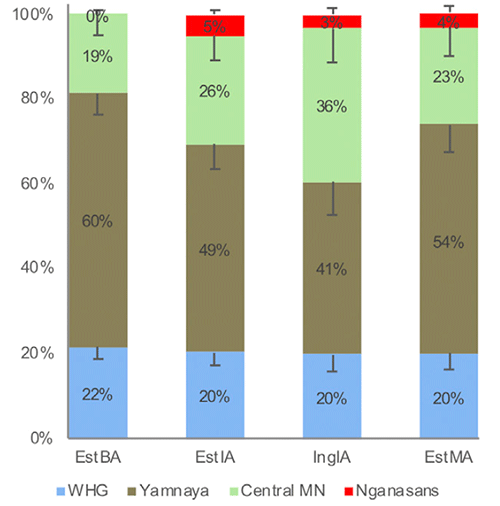
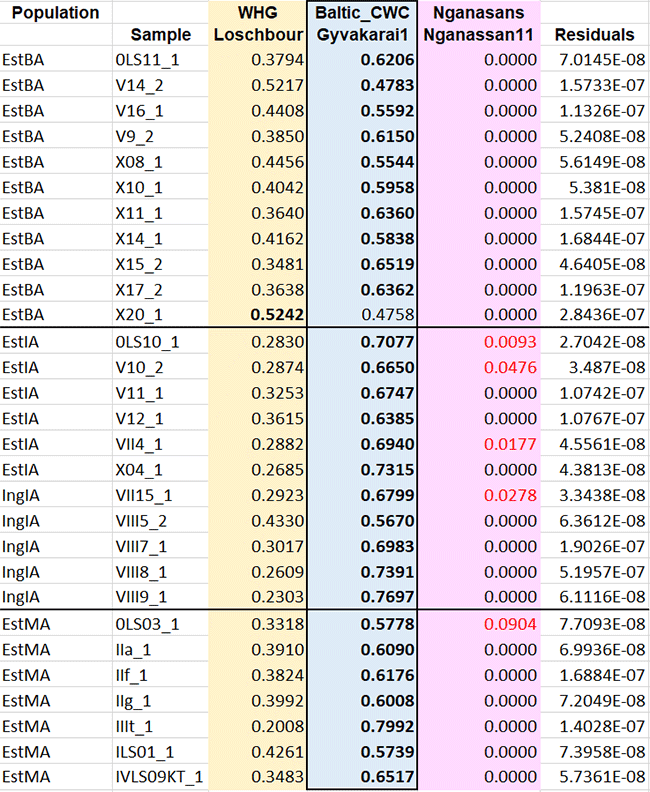
EstBA individuals have no Nganasan-related ancestry and EstIA, IngIA, and EstMA individuals on average have 2% or 4% (Figure 3; Data S1). The differentiation remains when using BA or IA Fennoscandian populations [26] instead of Nganasans (Data S1). Notably, the proportion of Nganasan-related ancestry varies between 0% and 12% among sampled EstIA, IngIA, and EstMA individuals (Data S1), which may suggest its relatively recent admixture into the target population. Moreover, two individuals from Kunda (0LS10 and V10) have the highest proportions of Nganasan ancestry among EstIA (6% and 8%), one of them has chrY hg N3a, and isotopic analysis suggests neither individual being born in Kunda [34].
About these two males from Tarand-graves, ‘foreign’ to Kunda:
0LS10: Male from tarand III (burial 9; TÜ 1325: L777), age 17–25 years [34]. He had a fragment of a sheep/goat bone and ceramics as grave goods. This burial has two radiocarbon dates: 2430 ± 35 BP (Poz-10801; 760–400 cal BC) and 2530 ± 41 BP (UBA-26114; 800–530 cal BC) [34]. According to the isotopic analysis, the person was not born in the vicinity of Kunda; his place of birth is still unknown (but south-western Finland and Sweden are excluded) [34]. Sampled tooth r P1.
V10: Male from tarand XI (burial 24; TÜ 1325: L1925), age 25–35 years [34], date 2484 ± 40 BP (UBA-26115; 790–430 cal BC) [34]. He had a few potsherds near the skull. Likewise, this person was not locally born [34]. Sampled tooth l P1.
The paper shows thus:
- Major continuity of ancestry from Corded Ware to modern Estonians, with only slight changes in different periods. In fact, one of the best fits for the Late Bronze Age ancestry is Gyvakarai1, one of the Corded Ware “outliers” described as “closer to Yamna”, which I already said may be closer to Sredni Stog/EHG populations instead. Another interesting take is that the change from Bronze Age to Iron Age corresponds to an increase in Baltic Corded Ware-related ancestry, rather than being driven by Siberian ancestry.
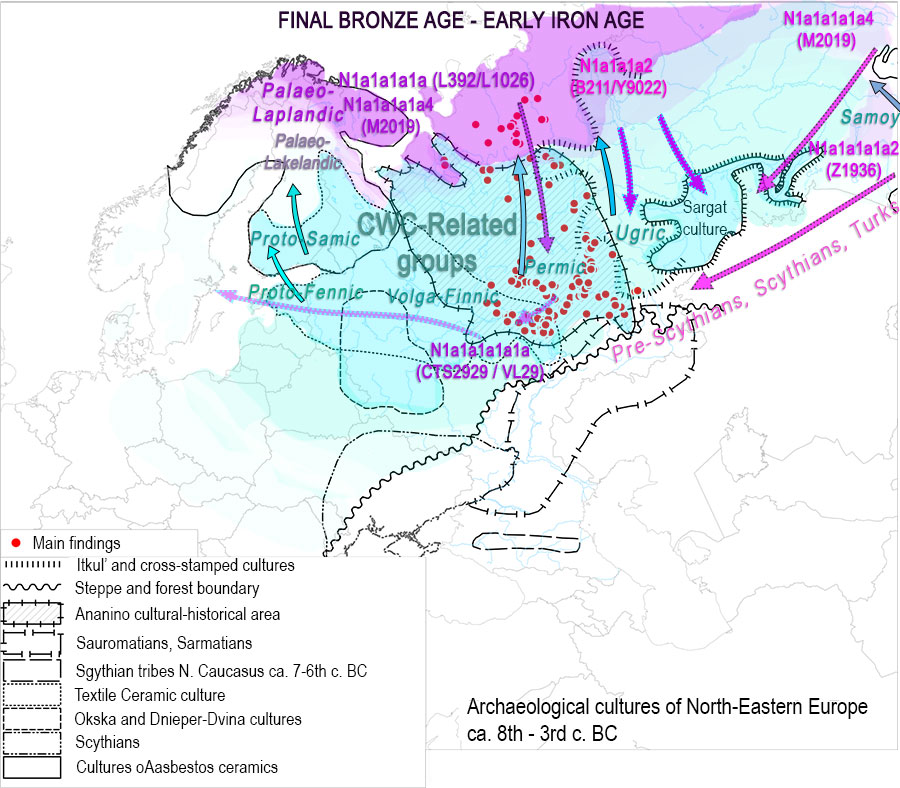
- A Volosovo-related migration of hg. N1c with Netted Ware into the area seems to be discarded, based on the full replacement of paternal lines and continuity of R1a-Z283. It is only during the Tarand-grave period when a system of chiefdoms (spread from Ananyino/Akozino) brings haplogroup N1c to the Gulf of Finland. During the Iron Age, the proportion of paternal lineages is still clearly in favour of R1a (50% in the coast, 100% in Ostrobothnia), which indicates a gradual replacement led by elites, likely because of the incorporation of Akozino warrior-traders spreading all over the Baltic, bringing the described shared Mordvinic traits in Fennic.
- The arrival of Akozino warrior-traders (bringing N1c and R1a lineages) was probably linked to this minimal “Nganasan-like” ancestry of some samples in the transition to the Iron Age. This arrival is supported by samples 0LS10 (the earliest hg. N1c) and V10 (of hg. R1a), both dated to ca. 800-400 BC, with V10 showing the highest “Nganasan-like” ancestry with 4.8%, both of them neighbouring samples showing 0%. This variable admixture among local and foreign paternal lineages might support the described social system of family alliances with intermarriages. In fact, a medieval sample, 0LS03_1 (hg. R1a) also shows a recent “Nganasan-like” ancestry, which probably points to the integration of different Arctic-related ancestry components among Modern Estonians, in this case related to Finnish expansions and thus integration of Levänluhta-related ancestry, as per the supplementary data.
- The expansion of haplogroup N1c among Finnic populations, as we are going to see in samples from the Middle Ages such as Luistari, is the consequence of late founder effects after huge bottlenecks expected based on the analysis of modern populations. The expansion of N1c-VL29 is different in origin from that of N1c-Z1936 among Samic (later integrated into Finnish populations), most likely from the east and originally associated with Lovozero Ware.
NOTE. Such minimal proportions of “Nganasan-like” ancestry evidence the process of admixture of Volga Finns in Akozino territory through their close interactions with Permians of Ananyino, who in turn acquired this Palaeo-Arctic admixture most likely during the expansion of the linguistic community to hunter-gatherer territories, to the north of the Cis-Urals. This process of stepped infiltration and expansion without language change is not dissimilar to the one seen among Indo-Iranians and Balto-Slavs of hg. R1b, or Vasconic speakers of hg. I2a, although in the case of Baltic Finns of hg. R1a the process of infiltration and expansion of hg. N1c is much less dramatic, with no radical replacement anywhere before the huge bottlenecks observable in Finns.
In spite of all this, the conclusion of the paper is (surprise!) that Siberian ancestry and hg. N heralded the arrival of Finnic to the Gulf of Finland in the Iron Age… However, this conclusion is supposedly* supported, not by their previous papers, but by a recent phylogenetic study by Honkola et al. (2013), which doesn’t actually argue for such a late ‘arrival’: it argues for the split of Balto-Finnic around 1500 BC.
NOTE. I say ‘supposedly’ because Kristiina Tambets, for example, has been following the link of Uralic with haplogroup N since the 2000s, so this is not some conclusion they just happened to misread from some random paper they Googled. In those initial assessments, she argued that the “ancient homeland” of the Tat C mutation suggested that Finno-Ugrians were in Fennoscandia before Indo-Europeans. Apparently, since haplogroup N appears later and from the east, it is now more important to follow this haplogroup than what is established in archaeology and linguistics.
Even in the referred paper, this split is considered an in situ development, since the phylogenetic study takes the information – among others – 1) from Parpola and Carpelan, who consider Netted Ware, a culture derived from Fatyanovo/Abashevo and Volosovo, as the culprit of the Finno-Ugric expansion; and 2) from Kallio (2006), who clearly states that Proto-Balto-Finnic (like Proto-Finno-Samic) was spoken around the Gulf of Finland during the Bronze Age. Both of them set the terminus ante quem of the language presence in the Baltic ca. 1900 BC.
Anyways, as a consequence of geneticists keeping these untenable pre-ancient DNA haplogroup-based arguments today, I expect to see this “Finnic” language expansion also described for the Western Baltic, Scandinavia or northern Europe, when this same proportion of hg. N1c and “Nganasan” ancestry is observed in Iron Age samples around the Baltic Sea. The nativist trends that this domination of “Finns” all over Northern Europe 2,500 years ago will create will be even more fun to read than the current ones…
EDIT (10 May 2019) How I see the reaction of many to ancient DNA, in keeping their old theories:
So, the Bronze Age results for Iberia I2a, Yamna/BBC R1b, Baikalic/Palaeo-Arctic N1c, and now Corded Ware/Fennoscandia R1a (https://t.co/AKPnqpQHsb …), mean that the simplistic associations of haplogroup-language by geneticists during the pre-ancient DNA era was *right*? Mmmm… pic.twitter.com/pq9tde2QiU
— Carlos Quiles (@cquilesc) May 10, 2019
Related
- Uralic speakers formed clines of Corded Ware ancestry with WHG:ANE populations
- The cradle of Russians, an obvious Finno-Volgaic genetic hotspot
- Common Slavs from the Lower Danube, expanding with haplogroup E1b-V13?
- Aquitanians and Iberians of haplogroup R1b are exactly like Indo-Iranians and Balto-Slavs of haplogroup R1a
- Magyar tribes brought R1a-Z645, I2a-L621, and N1a-L392(xB197) lineages to the Carpathian Basin
- R1a-Z280 and R1a-Z93 shared by ancient Finno-Ugric populations; N1c-Tat expanded with Micro-Altaic
- The complex origin of Samoyedic-speaking populations
- Corded Ware—Uralic (IV): Hg R1a and N in Finno-Ugric and Samoyedic expansions
- Corded Ware—Uralic (III): “Siberian ancestry” and Ugric-Samoyedic expansions
- Corded Ware—Uralic (II): Finno-Permic and the expansion of N-L392/Siberian ancestry
- The traditional multilingualism of Siberian populations
- Corded Ware—Uralic (I): Differences and similarities with Yamna
- Haplogroup R1a and CWC ancestry predominate in Fennic, Ugric, and Samoyedic groups