Last modified: 1st November 2017
ADMIXTURE free software
To install the software (as of today, the latest version is 1.3.0 – make sure this is the latest version, else download the latest one)
wget http://www.genetics.ucla.edu/software/admixture/binaries/admixture_linux-1.3.0.tar.gz

tar -zxvf admixture_linux-1.3.0.tar.gz

cd admixture_linux-1.3.0/
To use the program, do
./admixture
or (depending on your installation)
admixture
You can download the hapmap3 files for testing.
You can also work with your downloaded or merged BED files.
ADMIXTURE commands
ADMIXTURE documentation is so good and short and simple that anyone can use the necessary commands just by reading the manual.
Anyway, here is one possibility:
Wihin the ADMIXTURE folder, do either directly a command like this:
./admixture --cv -j2 MinMycNew.bed K
where K is the number of components.
Or use a file for slurm, create e.g. the file admixture.slurm with the following content:
#!/usr/bin/env bash

for K in {3,...,12}; do ./admixture --cv -j2 MinSS.bed $K | tee log${K}.out

 #Normally you should give --cv as first option to admixture

done
Instead of {3,…,12} you can also do {3,6,10} or any other combination.
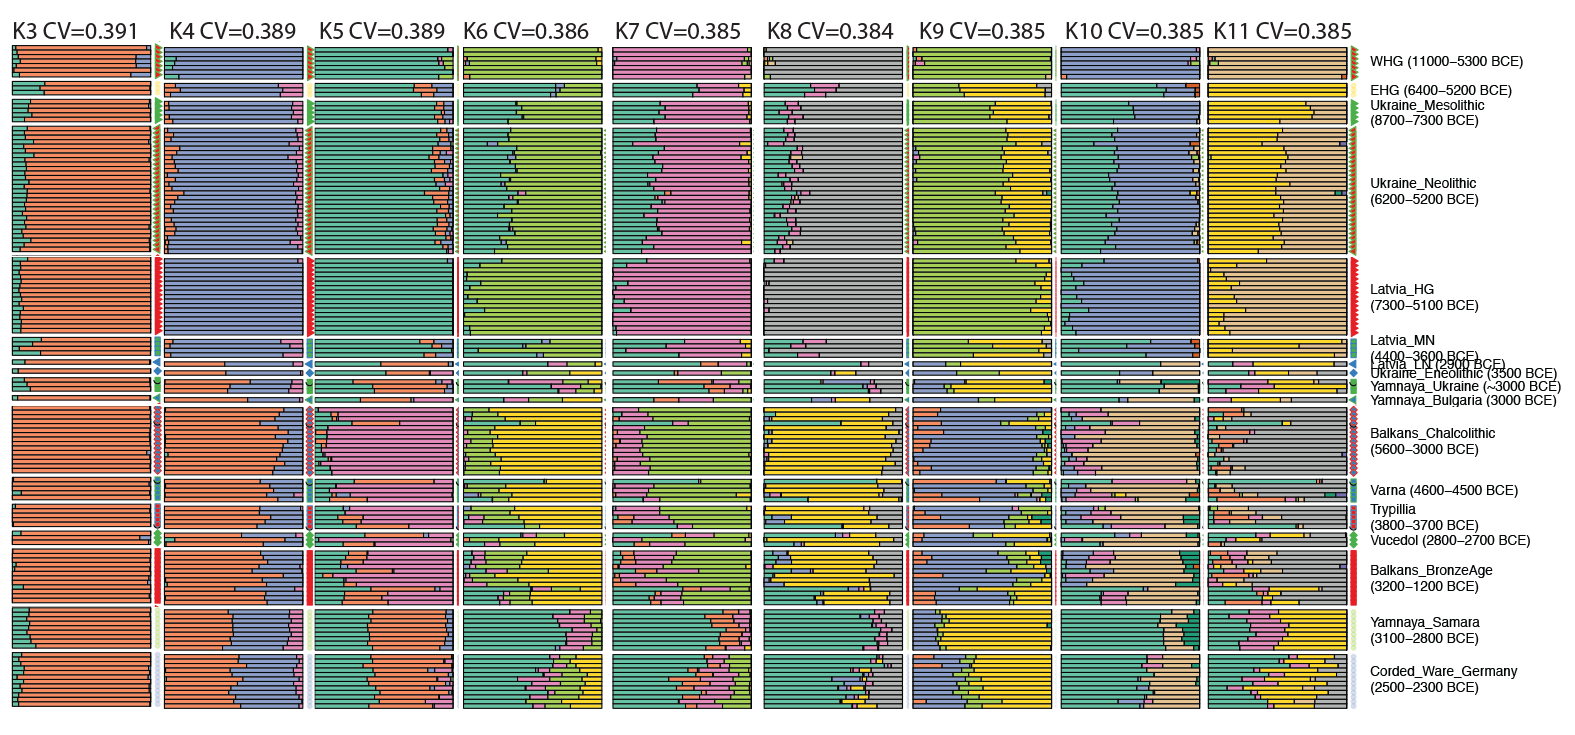
Use tee log${K}.out to be able to inspect the logs after completing the task. Especially important to derive certain conclusions about the ‘ideal number’ of K ancestral populations for your sample is the cross-validation flag –cv, which is logged in this file. You can read more about this here.
Once you have the file prepared and in the same folder as ADMIXTURE, do
sbatch admixture.slurm
You can see that it is working by trying
squeue
(Read about Slurm for more on this)
ADMIXTURE barplots in R
This is the code I have been trying for the graphical representation of eigenvalues in R.
You can select the whole text between #BEGIN BARPLOT and #END BARPLOT, paste it into a file named barplot.r, and it should work out of the box.
NOTE: This code uses files from a Windows folder (the default folder for Visual Studio) within my user folder /Carlos/. You need to replace these values with the correct file paths for your project system.
# BEGIN BARPLOT

#  Read data from eigenvalues (in this case the one for K=10) into data frame tbl

tbl = read.table("C:/Users/Carlos/source/MinSS/MinSS.10.Q")

## You can change the x number in MinSS.x.Q to reflect your selected barplot (see below)
#read data from regions into data frame indTable, and name columns appropriately

indTable = read.table("C:/Users/Carlos/source/MinSS/MinSS_ind",

col.names = c("Sample", "Sex", "Pop"))
## You can also use a spreadsheet software to modify the file MinSS. In my case, I used Microsoft Excel to open the merged MinSS.ind file: use File->Open MinSS.ind, and in the Text Import Wizard selected Fixed With, I select File Origin : Macintosh (although it could work with other options), Next>, then Next> again, then select General and Finish.
## Now you can work with the column you want to modify – usually the third one, which include labels – that is the one I called Pop in the import to indTable. In my case, I used this option to merge all labels as I wanted (for example, Bell Beakers and Corded Ware all into one, etc.) into a MinSS.txt which can be read into the data frame indTable instead of MinSS.ind
# Merge both data frames by Pop

mergedAdmixtureTable = cbind(tbl, indTable)

ordered = mergedAdmixtureTable[order(mergedAdmixtureTable$Pop),]
# Instruction to name bars:

barNaming <- function(vec) {

retVec <- vec

for (k in 2:length(vec)) {

if (vec[k - 1] == vec[k])

retVec[k] <- ""

}

return(retVec)

}
# This is necessary to save the plot in PDF

windows()
# These are parameters for the PDF that worked for me. Try changing width, and maybe height depending on your preferences

pdf(

file = "C:/Users/Carlos/source/MinSS/admixture10.pdf",

width = 12,

height = 50

)
# Size of the plot - these are margins, also related to the end appearance of the plot

par(mar = c(1, 20, 1, 1))
#This is my selection of colours and display for K=10 in MinSS.

barplot(t(as.matrix(ordered[, 1:10])),

col = c("darkkhaki", "blue3", "gold1", "pink", "darkviolet", "cyan2", "darkorange", "darkgoldenrod4", "forestgreen", "brown3"),
## You can search in Google for the available set of colours, and especially easy to use are colour names (e.g. see stowers.org). You can also use RGB colours with alpha values, but I haven’t tried them out.
## You could use aleatory colours with “col = rainbow(N),”
## This displays a vertical version (more suited for printing large datasets, in general)

horiz = FALSE,
# Displaying names for groups of rows ordered by Population:

names.arg = barNaming(ordered$Pop),

las = 2,

cex.axis = 0.1,

cex.names = 1,

)
## to see names sample by individual names:

## name names.arg = barNaming(ordered$Sample), las = 2)
#To print JPEG image

## dev.copy(jpeg,filename="plot.jpg");
dev.off()

# END BARPLOT
More instructions on performing ADMIXTURE analysis:
- GAWorkshop ADMIXTURE Analysis
- The section on Admixture analyses in the ISOGG Wiki might give you some more clues for what you need
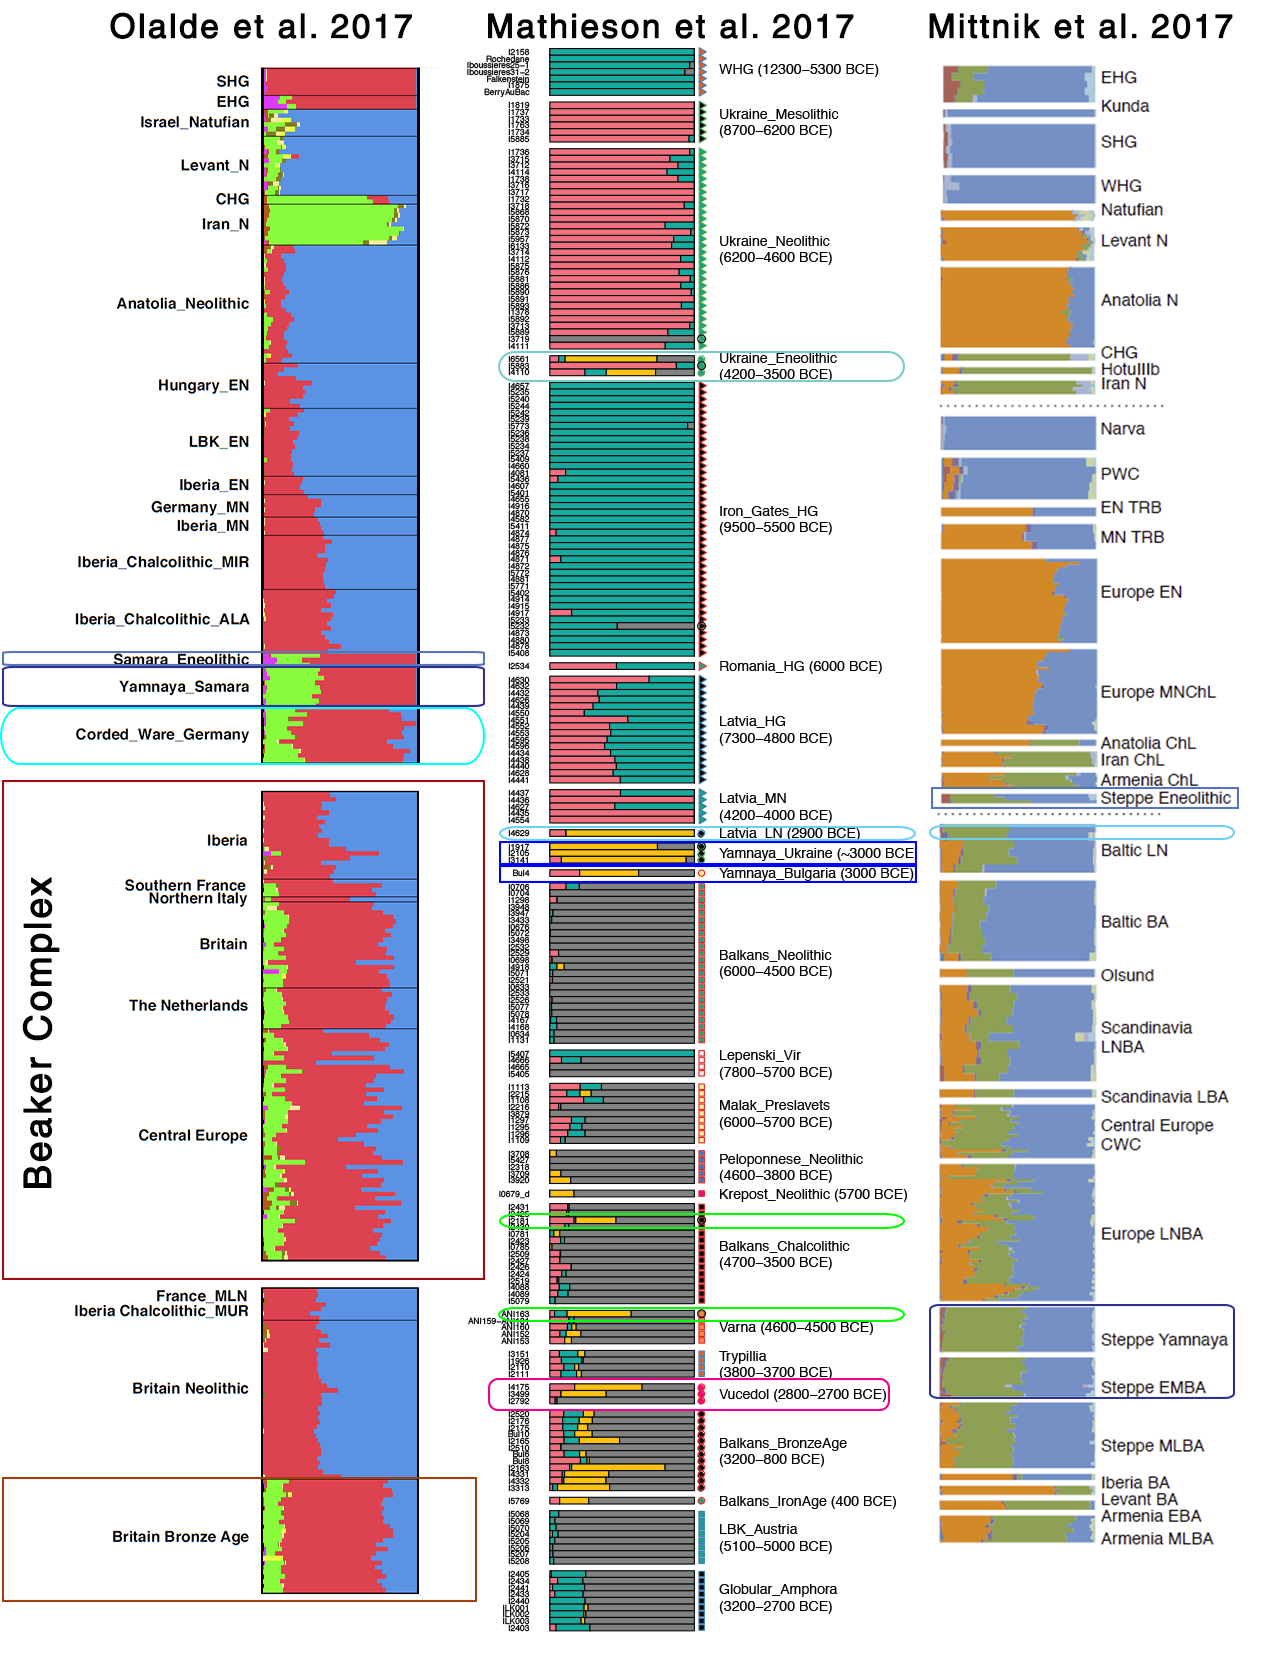
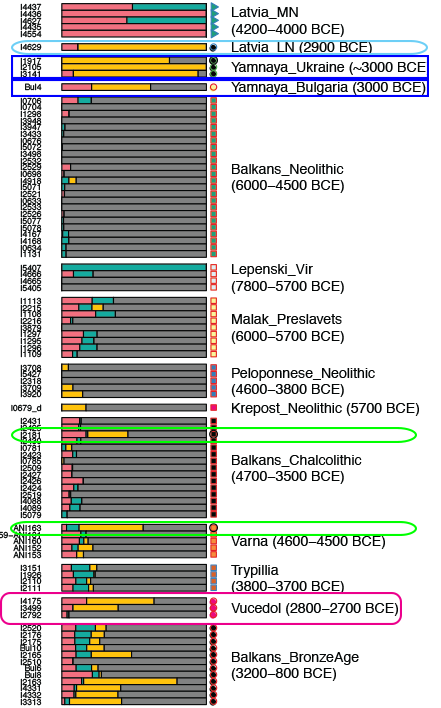
Samples
Samples used in the Indo-European demic diffusion model:

I got “Segmentation fault (core dumped)” error when trying to run ./admixture –cv -j2 file.bed K in Ubuntu.
I have my raw DNA data, but have no idea how to download it on admixture studio (not a faint clue)