Open access Genes reveal traces of common recent demographic history for most of the Uralic-speaking populations, by Tambets et al. Genome Biology (2018).
Interesting excerpts (emphasis mine):
Methods
A total of 286 samples of Uralic-speaking individuals, of those 121 genotyped in this study, were analysed in the context of 1514 Eurasian samples (including 14 samples published for the first time) based on whole genome single nucleotide polymorphisms (SNPs) (Additional file 1: Table S1). All these samples, together with the larger sample set of Uralic speakers, were characterized for mtDNA and chrY markers.
The question as which material cultures may have co-spread together with proto-Uralic and Uralic languages depends on the time estimates of the splits in the Uralic language tree. Deeper age estimates (6,000 BP) of the Uralic language tree suggest a connection between the spread of FU languages from the Volga River basin towards the Baltic Sea either with the expansion of the Neolithic culture of Combed Ware, e.g. [6, 7, 17, 26] or with the Neolithic Volosovo culture [7]. Younger age estimates support a link between the westward dispersion of Proto-Finno-Saamic and eastward dispersion of Proto-Samoyedic with a BA Sejma-Turbino (ST) cultural complex [14, 18, 27, 28] that mediated the diffusion of specific metal tools and weapons from the Altai Mountains over the Urals to Northern Europe or with the Netted Ware culture [23], which succeeded Volosovo culture in the west. It has been suggested that Proto-Uralic may have even served as the lingua franca of the merchants involved in the ST phenomenon [18]. All these scenarios imply that material culture of the Baltic Sea area in Europe was influenced by cultures spreading westward from the periphery of Europe and/or Siberia. Whether these dispersals involved the spread of both languages and people remains so far largely unknown.
The population structure of Uralic speakers
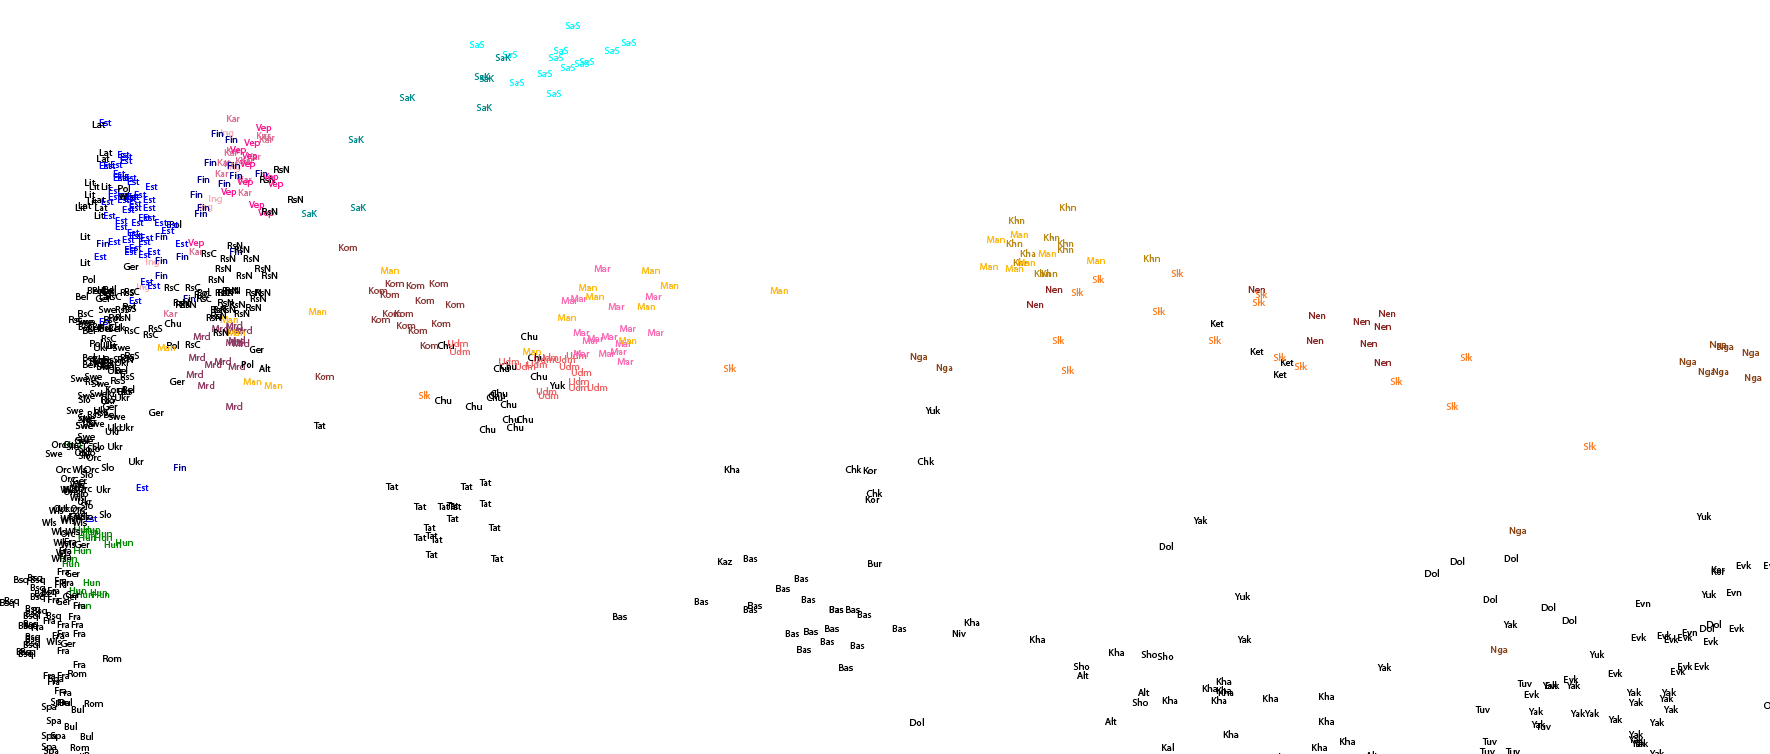
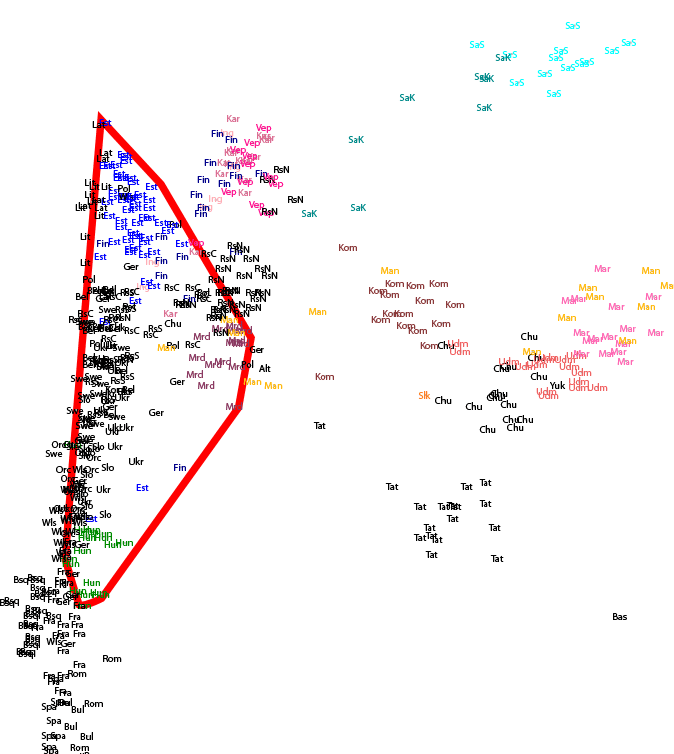
To contextualize the autosomal genetic diversity of Uralic speakers among other Eurasian populations (Additional file 1: Table S1), we first ran the principal component (PC) analysis (Fig. 2a, Additional file 3: Figure S1). The first two PCs (Fig. 2a, Additional file 3: Figure S1A) sketch the geography of the Eurasian populations along the East-West and North-South axes, respectively. The Uralic speakers, along with other populations speaking Slavic and Turkic languages, are scattered along the first PC axis in agreement with their geographic distribution (Figs. 1 and 2a) suggesting that geography is the main predictor of genetic affinity among the groups in the given area. Secondly, in support of this, we find that FST-distances between populations (Additional file 3: Figure S2) decay in correlation with geographical distance (Pearson’s r = 0.77, p < 0.0001). On the UPGMA tree based on these FST-distances (Fig. 2b), the Uralic speakers cluster into several different groups close to their geographic neighbours.
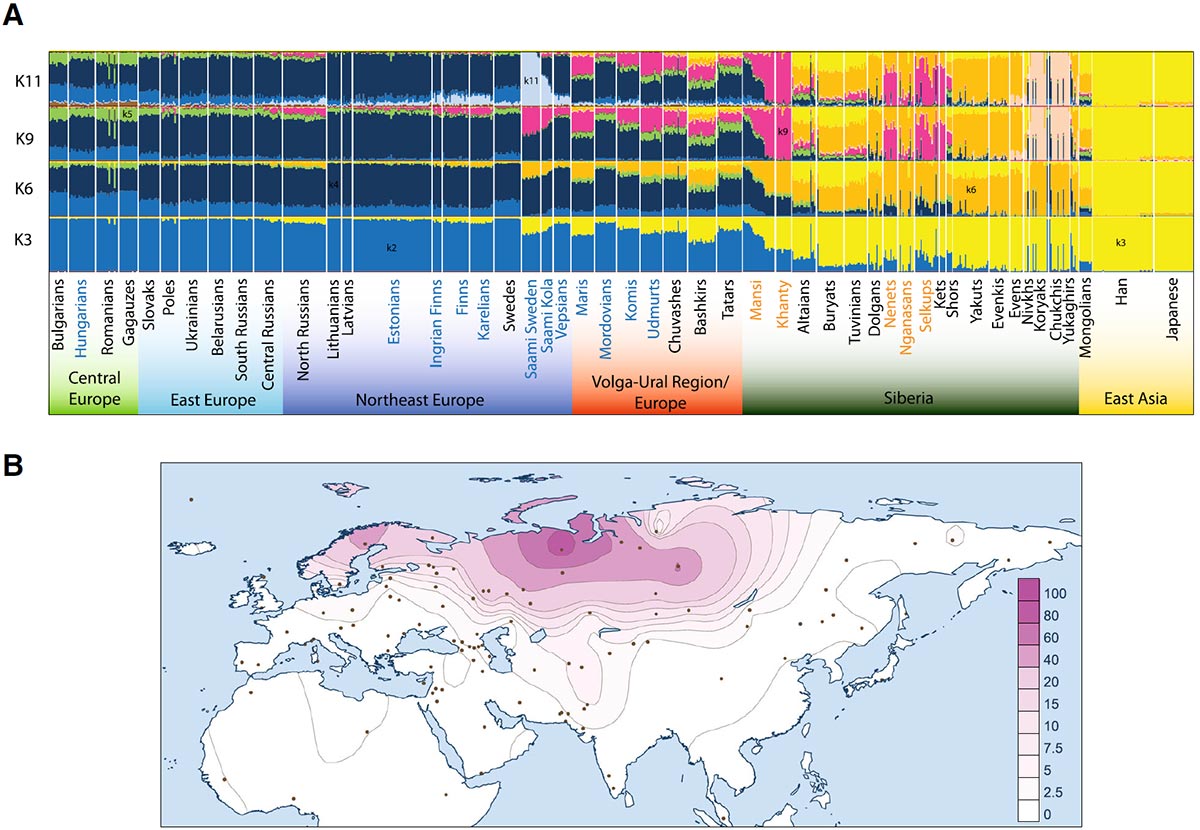
We next used ADMIXTURE [48], which presents the individuals as composed of inferred genetic components in proportions that maximize Hardy-Weinberg and linkage equilibrium in the overall sample (see the ‘Methods’ section for choice of presented K). Overall, and specifically at lower values of K, the genetic makeup of Uralic speakers resembles that of their geographic neighbours. The Saami and (a subset of) the Mansi serve as exceptions to that pattern being more similar to geographically more distant populations (Fig. 3a, Additional file 3: S3). However, starting from K = 9, ADMIXTURE identifies a genetic component (k9, magenta in Fig. 3a, Additional file 3: S3), which is predominantly, although not exclusively, found in Uralic speakers. This component is also well visible on K = 10, which has the best cross-validation index among all tests (Additional file 3: S3B). The spatial distribution of this component (Fig. 3b) shows a frequency peak among Ob-Ugric and Samoyed speakers as well as among neighbouring Kets (Fig. 3a). The proportion of k9 decreases rapidly from West Siberia towards east, south and west, constituting on average 40% of the genetic ancestry of FU speakers in Volga-Ural region (VUR) and 20% in their Turkic-speaking neighbours (Bashkirs, Tatars, Chuvashes; Fig. 3a). The proportion of this component among the Saami in Northern Scandinavia is again similar to that of the VUR FU speakers, which is exceptional in the geographic context. It is also notable that North Russians, sampled from near the White Sea, differ from other Russians by sporting higher proportions of k9 (10–15%), which is similar to the values we observe in their Finnic-speaking neighbours. Notably, Estonians and Hungarians, who are geographically the westernmost Uralic speakers, virtually lack the k9 cluster membership.
We also tested the different demographic histories of female and male lineages by comparing outgroup f3 results for autosomal and X chromosome (chrX) data for pairs of populations (Estonians, Udmurts or Khanty vs others) with high versus low probability to share their patrilineal ancestry in chrY hg N (see the ‘Methods’ section, Additional file 3: Figure S13). We found a minor but significant excess of autosomal affinity relative to chrX for pairs of populations that showed a higher than 10% chance of two randomly sampled males across the two groups sharing their chrY ancestry in hg N3-M178, compared to pairs of populations where such probability is lower than 5% (Additional file 3: Figure S13).
In sum, these results suggest that most of the Uralic speakers may indeed share some level of genetic continuity via k9, which, however, also extends to the geographically close Turkic speakers.
Identity-by-descent
We found that it is the admixture with the Siberians that makes the Western Uralic speakers different from the tested European populations (Additional file 3: Figure S4A-F, H, J, L). Differentiating between Estonians and Finns, the Siberians share more derived alleles with Finns, while the geographic neighbours of Estonians (and Finns) share more alleles with Estonians (Additional file 3: Figure S4M). Importantly, Estonians do not share more derived alleles with other Finnic, Saami, VUR FU or Ob-Ugric-speaking populations than Latvians (Additional file 3: Figure S4O). The difference between Estonians and Latvians is instead manifested through significantly higher levels of shared drift between Estonians and Siberians on the one hand and Latvians and their immediate geographic neighbours on the other hand. None of the Uralic speakers, including linguistically close Khanty and Mansi, show significantly closer affinities to the Hungarians than any non-FU population from NE Europe (Additional file 3: Figure S4R).
Time of Siberian admixture
The time depth of the Globetrotter (Fig. 5b) inferred admixture events is relatively recent—500–1900 AD (see also complementary ALDER results, in Additional file 13: Table S12 and Additional file 3: Figure S7)—and agrees broadly with the results reported in Busby et al. [55]. A more detailed examination of the ALDER dates, however, reveals an interesting pattern. The admixture events detected in the Baltic Sea region and VUR Uralic speakers are the oldest (800–900 AD or older) followed by those in VUR Turkic speakers (∼1200–1300 AD), while the admixture dates for most of the Siberian populations (>1500 AD) are the most recent (Additional file 3: Figure S7). The West Eurasian influx into West Siberia seen in modern genomes was thus very recent, while the East Eurasian influx into NE Europe seems to have taken place within the first millennium AD (Fig. 5b, Additional file 3: Figure S7).
Affinities of the Uralic speakers with ancient Eurasians
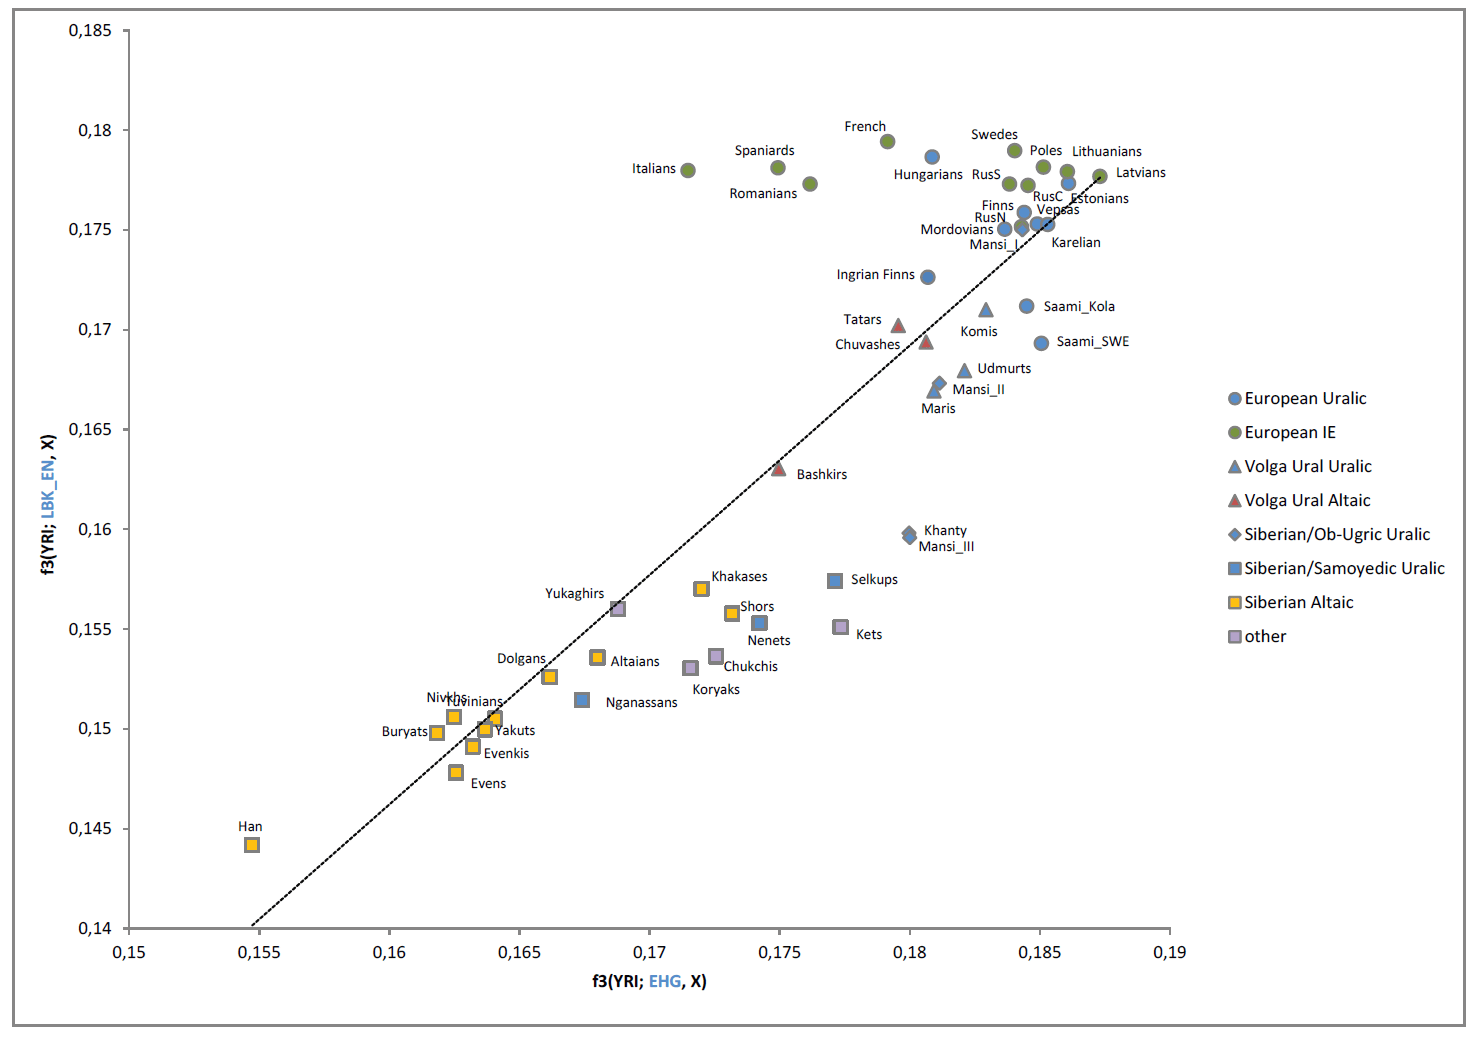
We next calculated outgroup f3-statistics [48] to estimate the extent of shared genetic drift between modern and ancient Eurasians (Additional file 14: Table S13, Additional file 3: Figures S8-S9). Consistent with previous reports [45, 50], we find that the NE European populations including the Uralic speakers share more drift with any European Mesolithic hunter-gatherer group than Central or Western Europeans (Additional file 3: Figure S9A-C). Contrasting the genetic contribution of western hunter-gatherers (WHG) and eastern hunter-gatherers (EHG), we find that VUR Uralic speakers and the Saami share more drift with EHG. Conversely, WHG shares more drift with the Finnic and West European populations (Additional file 3: Figure S9A). Interestingly, we see a similar pattern of excess of shared drift between VUR and EHG if we substitute WHG with the aDNA sample from the Yamnaya culture (Additional file 3: Figure S9D). As reported before [2, 45], the genetic contribution of European early farmers decreases along an axis from Southern Europe towards the Ural Mountains (Fig. 6, Additional file 3: Figure S9E-F).
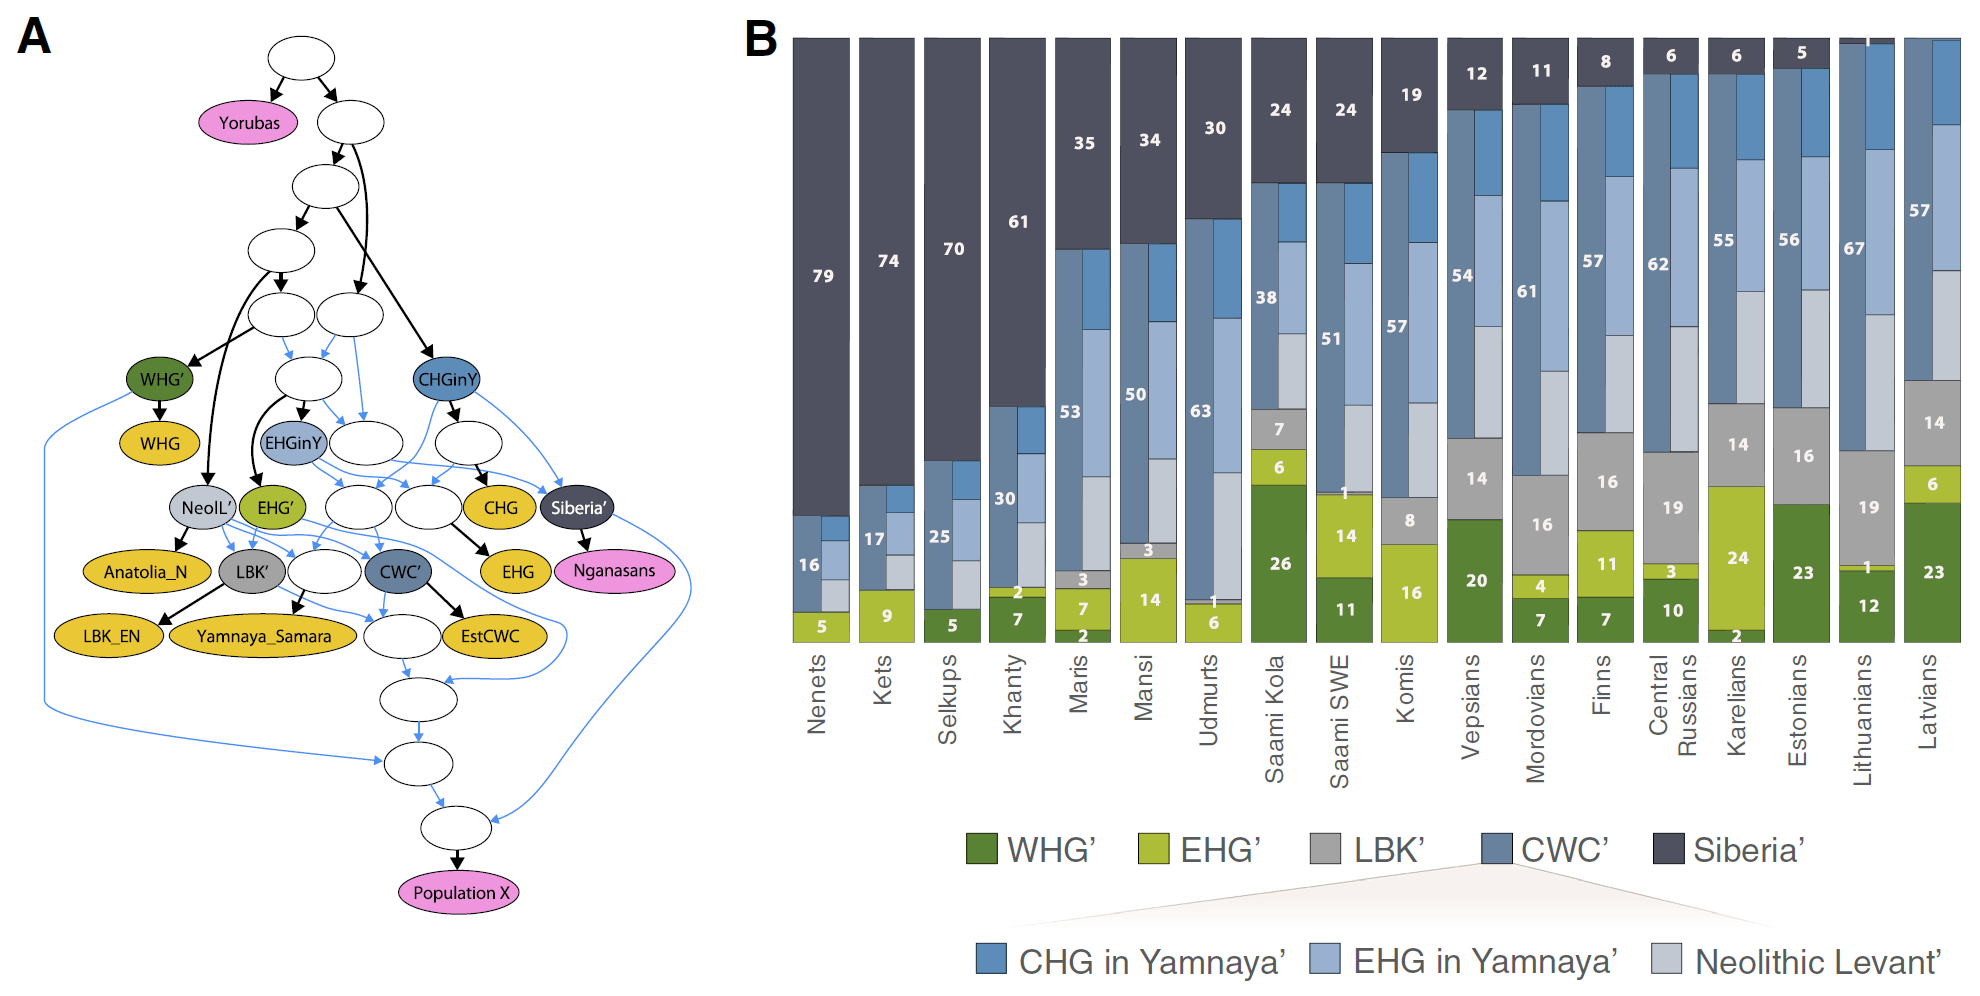
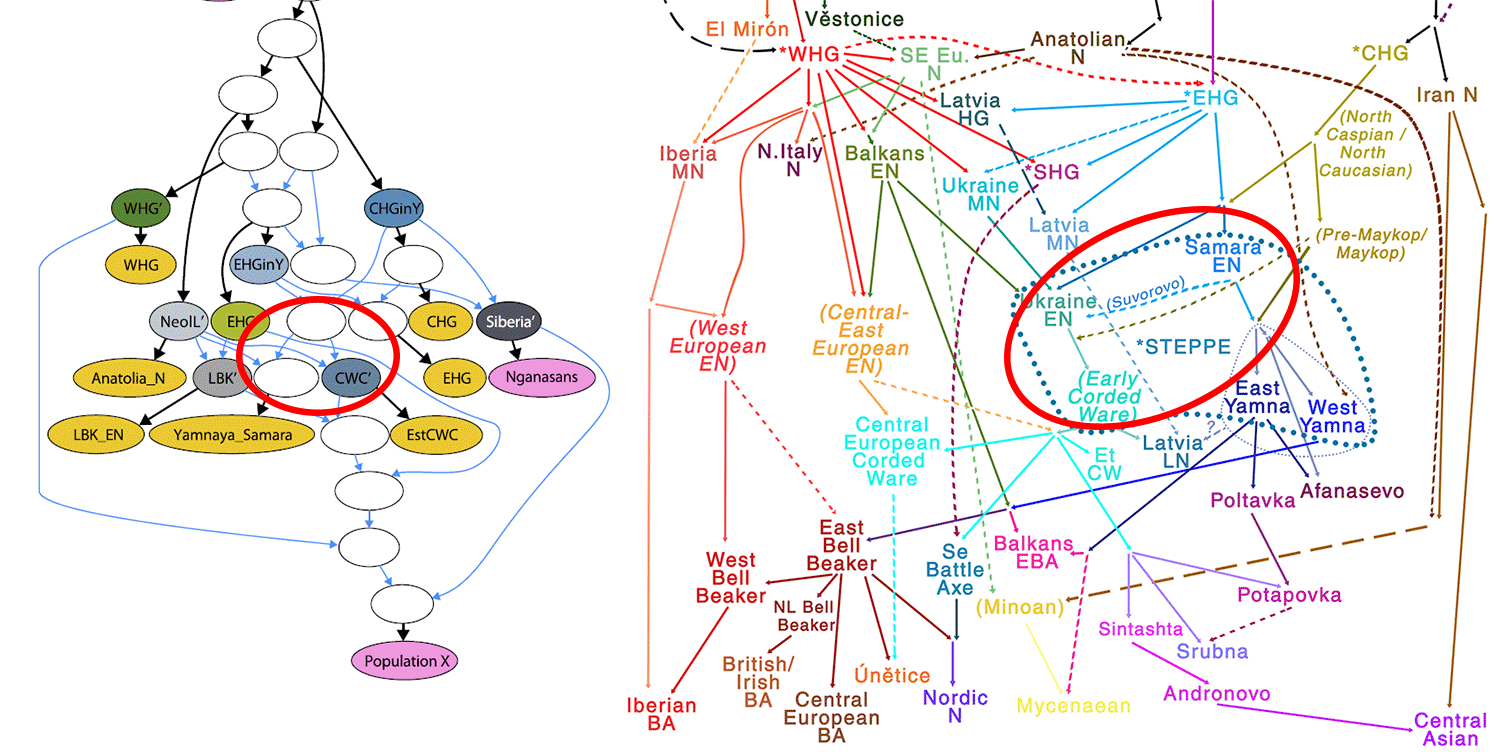
We then used the qpGraph software [48] to test alternative demographic scenarios by trying to fit the genetic diversity observed in a range of the extant Finno-Ugric populations through a model involving the four basic European ancestral components: WHG, EHG, early farmers (LBK), steppe people of Yamnaya/Corded Ware culture (CWC) and a Siberian component (Fig. 6, Additional file 3: Figure S10). We chose the modern Nganasans to serve as a proxy for the latter component because we see least evidence for Western Eurasian admixture (Additional file 3: Figure S3) among them. We also tested the Khantys for that proxy but the model did not fit (yielding f2-statistics, Z-score > 3). The only Uralic-speaking population that did not fit into the tested model with five ancestral components were Hungarians. The qpGraph estimates of the contributions from the Siberian component show that it is the main ancestry component in the West Siberian Uralic speakers and constitutes up to one third of the genomes of modern VUR and the Saami (Fig. 6). It drops, however, to less than 10% in most of NE Europe, to 5% in Estonians and close to zero in Latvians and Lithuanians.
Discussion
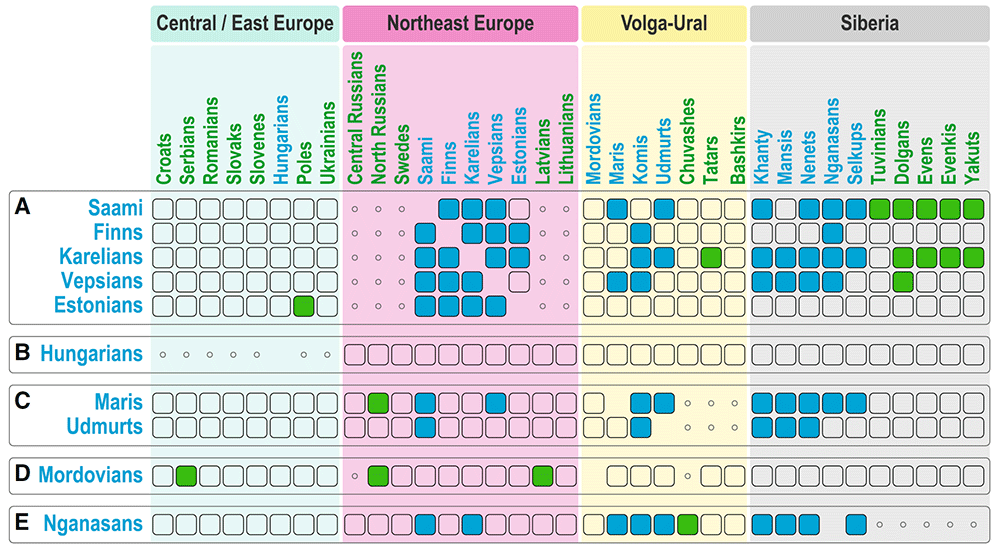
One of the notable observations that stands out in the fineSTRUCTURE analysis is that neither Hungarians nor Estonians or Mordovians form genetic clusters with other Uralic speakers but instead do so with a broad spectrum of geographically adjacent samples. Despite the documented history of the migration of Magyars [63] and their linguistic affinity to Khantys and Mansis, who today live east of the Ural Mountains, there is nothing in the present-day gene pool of the sampled Hungarians that we could tie specifically to other Uralic speakers.
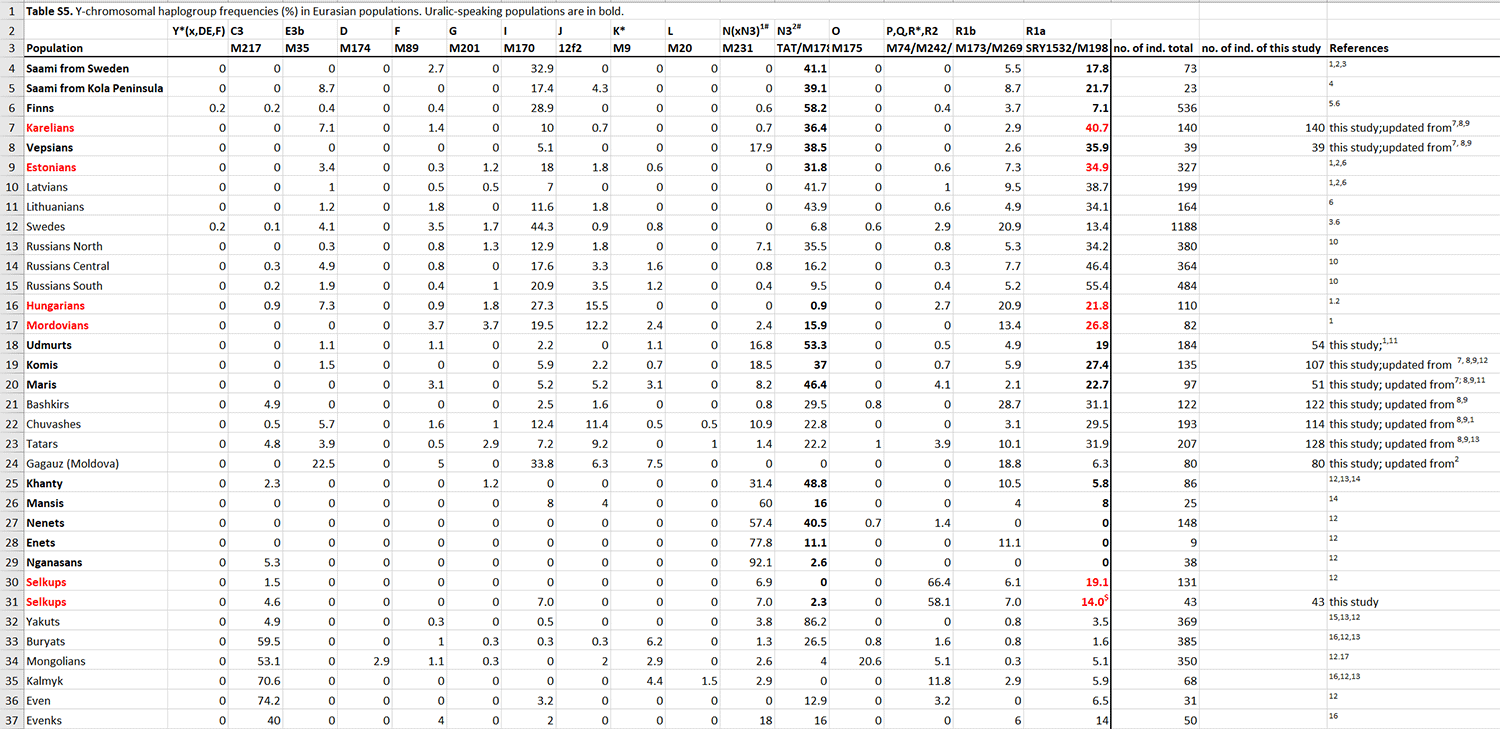
Perhaps even more surprisingly, we found that Estonians, who show close affinities in IBD analysis to neighbouring Finnic speakers and Saami, do not share an excess of IBD segments with the VUR or Siberian Uralic speakers. This is eIn this context, it is important to remind that the limited (5%, Fig. 6) East Eurasian impact in the autosomal gene pool of modern Estonians contrasts with the fact that more than 30% of Estonian (but not Hungarian) men carry chrY N3 that has an East Eurasian origin and is very frequent among NE European Uralic speakers [36]. However, the spread of chrY hg N3 is not language group specific as it shows similar frequencies in Baltic-speaking Latvians and Lithuanians, and in North Russians, who in all our analyses are very similar to Finnic-speakers. The latter, however, are believed to have either significantly admixed with their Uralic-speaking neighbours or have undergone a language shift from Uralic to Indo-European [38].ven more striking considering that the immediate neighbours—Finns, Vepsians and Karelians—do.
With some exceptions such as Estonians, Hungarians and Mordovians, both IBD sharing and Globetrotter results suggest that there are detectable inter-regional haplotype sharing ties between Uralic speakers from West Siberia and VUR, and between NE European Uralic speakers and VUR. In other words, there is a fragmented pattern of haplotype sharing between populations but no unifying signal of sharing that unite all the studied Uralic speakers.
Comments
The paper is obviously trying to find a “N1c/Siberian ancestry = Uralic” link, but it shows (as previous papers using ancient DNA) that this identification is impossible, because it is not possible to identify “N1c=Siberian ancestry”, “N1c=Uralic”, or “Siberian ancestry = Uralic”. In fact, the arrival of N subclades and Siberian ancestry are late, both events (probably multiple stepped events) are unrelated to each other, and represent east-west demic diffusion waves (as well as founder effects) that probably coincide in part with the Scythian and Turkic (or associated) expansions, i.e. too late for any model of Proto-Uralic or Proto-Finno-Ugric expansion.
On the other hand, it shows interesting data regarding ancestry of populations that show increased Siberian influence, such as those easternmost groups admixed with Yeniseian-like populations (Samoyedic), those showing strong founder effects (Finnic), or those isolated in the Circum-Artic region with neighbouring Siberian peoples in Kola (Saami). All in all, Hungarians, Estonians and Mordovians seem to show the original situation better than the other groups, which is also reflected in part in Y-DNA, conserved as a majority of R1a lineages precisely in these groups. Just another reminder that CWC-related ancestry is found in every single Uralic group, and that it represents the main ancestral component in all non-Samoyedic groups.
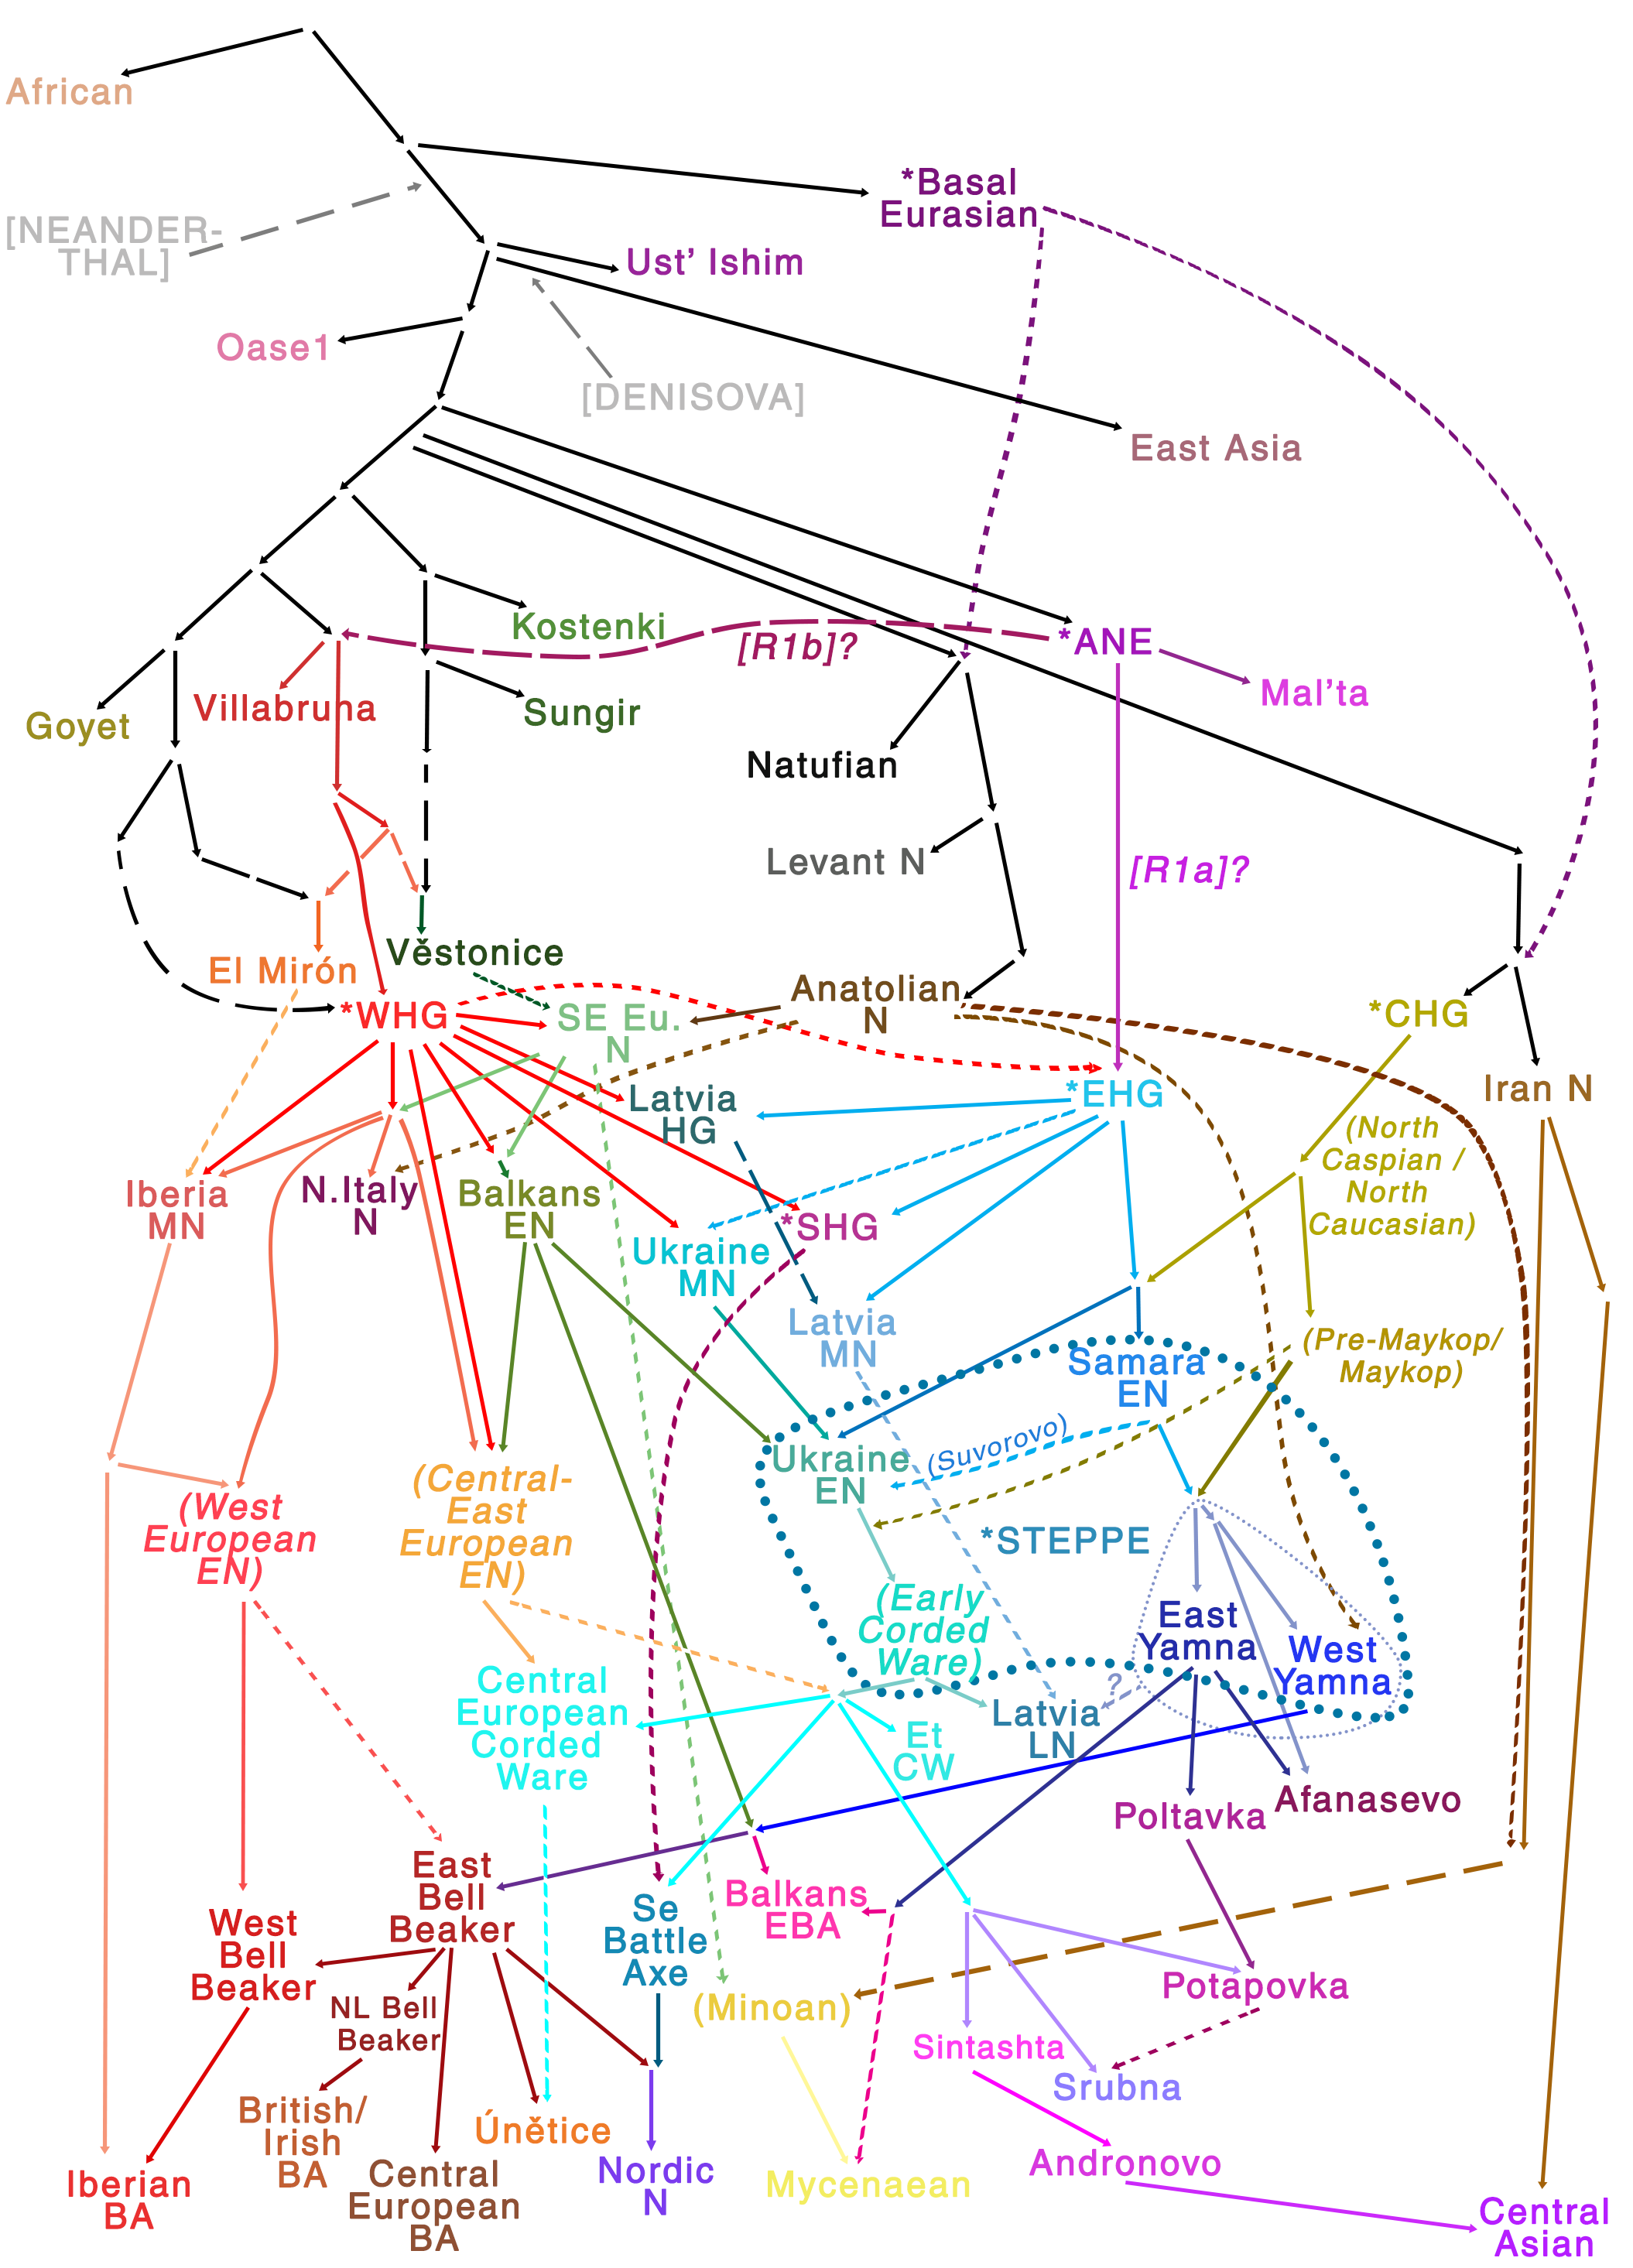
The qpGraph shows the ancestor of Yamna (likely Khvalynsk) and Corded Ware stemming as different populations from a common (likely Neolithic) node – whose difference is based on the proportion of Anatolian-related ancestry – , that is, probably before the Indo-Hittite expansion; and ends with CWC groups forming the base for all Uralic peoples. Below is a detail of the qpGraph on the left, and my old guess (2017) on the right, for comparison:
#EDIT (22 sep 2018): I enjoyed re-reading it, and found this particular paragraph funny:
Despite the documented history of the migration of Magyars [63] and their linguistic affinity to Khantys and Mansis, who today live east of the Ural Mountains, there is nothing in the present-day gene pool of the sampled Hungarians that we could tie specifically to other Uralic speakers.
They are so obsessed with finding a link to Siberian ancestry and N1c, and so convinced of Kristiansen’s idea of CWC=Indo-European, that they forgot to examine their own data from a critical point of view, and see the clear link between all Uralic peoples with Corded Ware ancestry and R1a-Z645 subclades… Here is a reminder about Hungarians and R1a-Z282, and about the expansion of R1a-Z645 with Uralic peoples.
Related
- The Iron Age expansion of Southern Siberian groups and ancestry with Scythians
- Evolution of Steppe, Neolithic, and Siberian ancestry in Eurasia (ISBA 8, 19th Sep)
- Mitogenomes from Avar nomadic elite show Inner Asian origin
- On the origin and spread of haplogroup R1a-Z645 from eastern Europe
- Oldest N1c1a1a-L392 samples and Siberian ancestry in Bronze Age Fennoscandia
- Consequences of Damgaard et al. 2018 (III): Proto-Finno-Ugric & Proto-Indo-Iranian in the North Caspian region
- The concept of “Outlier” in Human Ancestry (III): Late Neolithic samples from the Baltic region and origins of the Corded Ware culture
- Genetic prehistory of the Baltic Sea region and Y-DNA: Corded Ware and R1a-Z645, Bronze Age and N1c
- More evidence on the recent arrival of haplogroup N and gradual replacement of R1a lineages in North-Eastern Europe
- Another hint at the role of Corded Ware peoples in spreading Uralic languages into north-eastern Europe, found in mtDNA analysis of the Finnish population
- New Ukraine Eneolithic sample from late Sredni Stog, near homeland of the Corded Ware culture