I have compiled for two years now the reported Y-DNA and mtDNA haplogroups of ancient DNA samples published, including also SNPs from analysis of the BAM files by hobbyists.
Y-DNA timeline
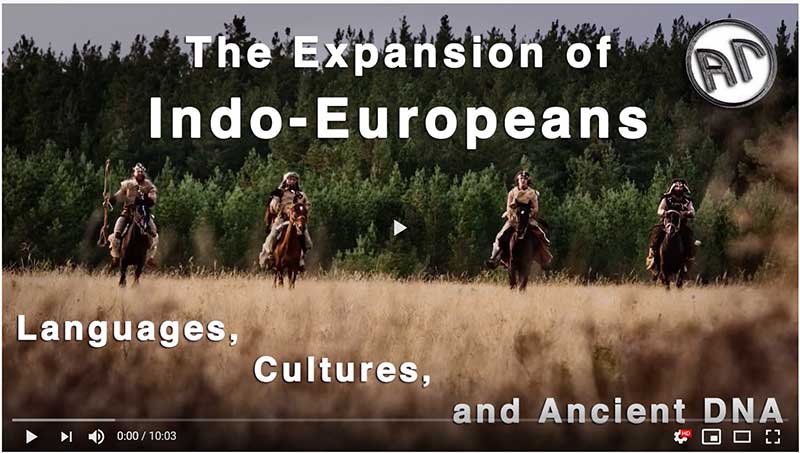
Here is a video with a timeline of the evolution of Indo-European speakers, according to what is known today about reconstructed languages, prehistoric cultures and ancient DNA:
NOTE. The video is best viewed in HD 1080p (1920×1080) with a display that allows for this or greater video quality, and a screen big enough to see haplogroup symbols, i.e. tablet or greater. The YouTube link is here. The Facebook link is here.
Based on the results of the past 5 years or so, which have been confirming this combined picture every single time, I doubt there will be much need to change it in any radical way, as only minor details remain to be clarified.
#UPDATE (10 JUNE 2020):
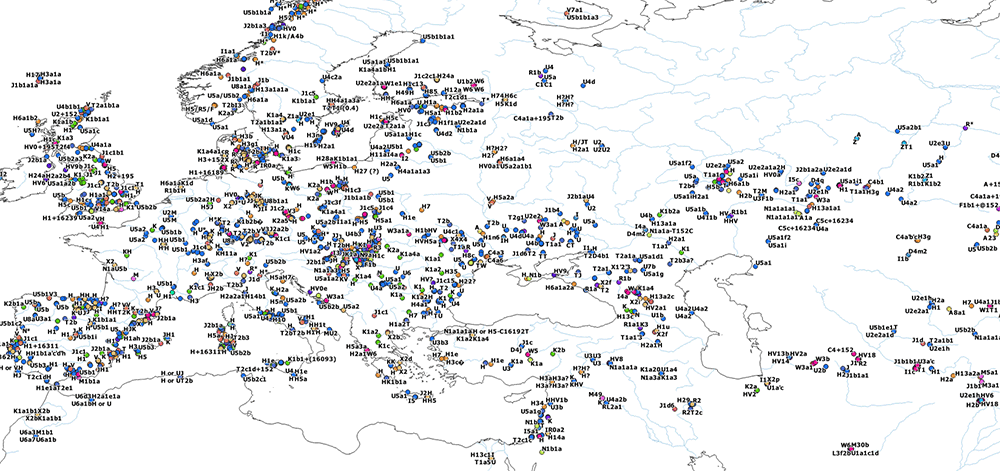
Y-DNA and mtDNA maps
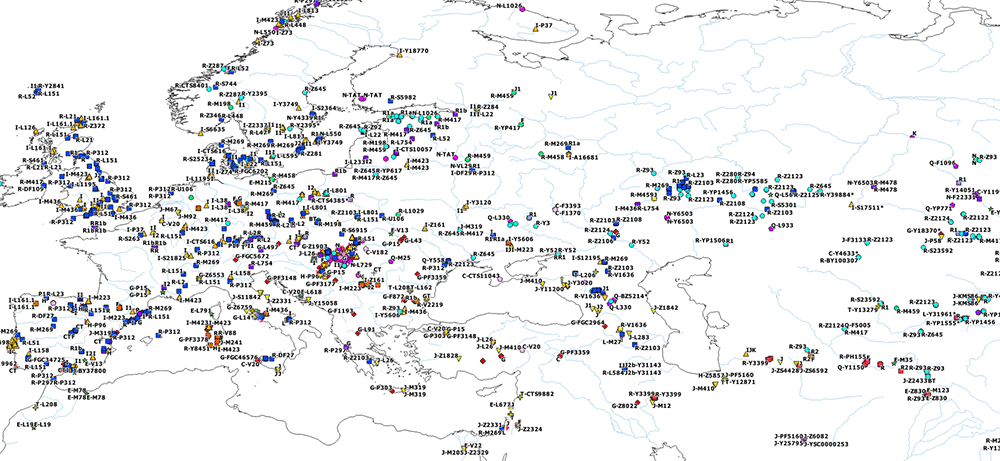
I wanted to publish a GIS tool of my own for everyone to have an updated reference of the All Ancient DNA dataset I use for my books.
The most complex tools available consume too many resources when used online in a client-server model, so I have to keep that to myself, but there are some ways to publish low quality outputs with QGIS.
The OpenLayers files below include the possibility to zoom some levels to be able to see more samples, and also to check each one for more information on their ID, attributed culture and label, archaeological site, source paper, subclade (and people responsible for SNP inferences if any), etc.
Some usage notes:
- Files are large (ca. 15-20 and up to 50 Mb), so they still take some time to load.
- For the meaning of symbols and colors (for Y-DNA haplogroups), if there is any doubt, check the video above and the All Ancient DNA dataset.
- Pop-ups with sample information will work on desktop browsers by clicking on them, apparently not on smartphone and related tactile OS.
- I added files with pop-ups on hover, so that it now works (to some extent) on tactile OS.
- The search tool can look for specific samples according to their official ID, and works by highlighting the symbol of the selected individual (turning it into a bright blue dot), and leading the layer view to the location, but it seems to work best only with some browser and OS settings – in other browsers, you need to zoom out to see where the dot is located. The specific sample with its information could paradoxically disappear in search mode, so you might need to reload and look again for the same site that was highlighted.
- Latitude and longitude values have been randomly modified to avoid samples overcrowding specific sites, so they are not the original ones.
Y-DNA OpenLayers Maps
These are the different versions available:
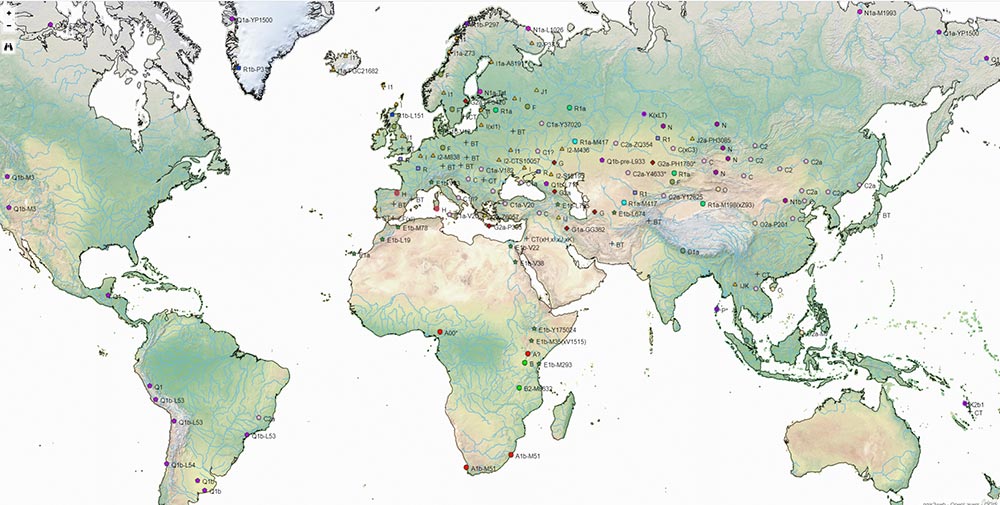
General (June 2020):
![]() With blank background rivers and lakes (38.7 Mb).
With blank background rivers and lakes (38.7 Mb).
- Version with labels for smartphone / tactile OS devices (automatic pop-ups on hover).
![]() With physical background and rivers (46.3 Mb).
With physical background and rivers (46.3 Mb).
Divided by ages according to cultural maps (June 2020):
1. ![]() Out of Africa.
Out of Africa.
3. ![]() Epipalaeolithic.
Epipalaeolithic.
4. ![]() Early Mesolithic.
Early Mesolithic.
5. ![]() Late Mesolithic.
Late Mesolithic.
6. ![]() Neolithic and hunter-gatherer pottery.
Neolithic and hunter-gatherer pottery.
7. ![]() Early Eneolithic.
Early Eneolithic.
8. ![]() Late Eneolithic.
Late Eneolithic.
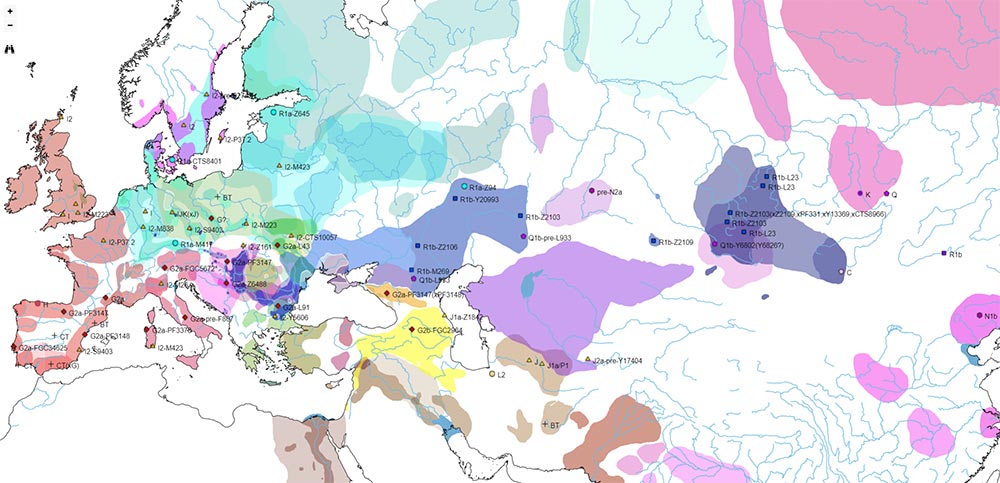
11. ![]() Late Chalcolithic.
Late Chalcolithic.
12. ![]() Early Bronze Age.
Early Bronze Age.
13. ![]() Middle Bronze Age.
Middle Bronze Age.
14. ![]() Late Bronze Age.
Late Bronze Age.
15. ![]() Early Iron Age.
Early Iron Age.
16. ![]() Late Iron Age.
Late Iron Age.
17. ![]() Antiquity.
Antiquity.
18. ![]() Middle Ages.
Middle Ages.
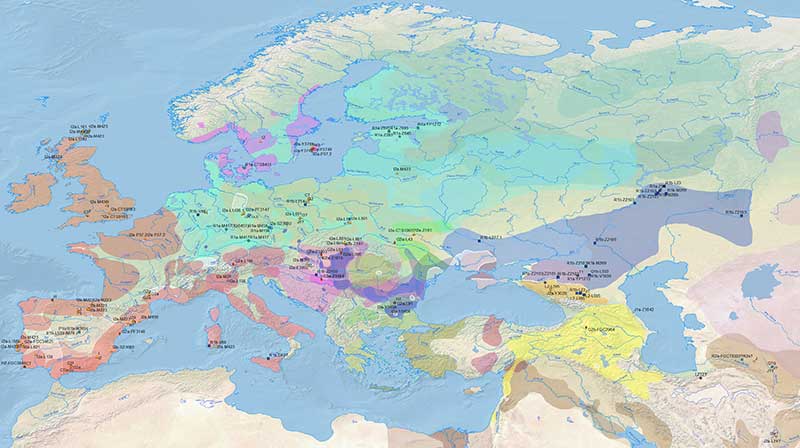
mtDNA OpenLayers Maps
There are different versions:
NOTE. Because there are too many samples at the starting view, depending on the file you should zoom some levels to start seeing symbols.
General (June 2020):
![]() With blank background, rivers and lakes (41.3 Mb).
With blank background, rivers and lakes (41.3 Mb).
![]() With physical background and rivers (49.1 Mb).
With physical background and rivers (49.1 Mb).
Divided by ages according to cultural maps (June 2020):
3. ![]() Epipalaeolithic.
Epipalaeolithic.
4. ![]() Early Mesolithic.
Early Mesolithic.
5. ![]() Late Mesolithic.
Late Mesolithic.
6. ![]() Neolithic and hunter-gatherer pottery.
Neolithic and hunter-gatherer pottery.
7. ![]() Early Eneolithic.
Early Eneolithic.
8. ![]() Late Eneolithic.
Late Eneolithic.
11. ![]() Late Chalcolithic.
Late Chalcolithic.
12. ![]() Early Bronze Age.
Early Bronze Age.
13. ![]() Middle Bronze Age.
Middle Bronze Age.
14. ![]() Late Bronze Age.
Late Bronze Age.
15. ![]() Early Iron Age.
Early Iron Age.
16. ![]() Late Iron Age.
Late Iron Age.
17. ![]() Antiquity.
Antiquity.
18. ![]() Middle Ages.
Middle Ages.
Smartphone / Tactile OS (Dec 2019):
Static Maps
The following maps offer a timeline of Y-DNA and mtDNA evolution, divided into static periods corresponding to the Prehistoric Atlas.
Y-DNA + culture maps
The following files use the YTree or otherwise more comprehensive nomenclature than YFull. Symbols have a similar value as those from the GIS tools.
 Anatomically Modern Humans (PDF)
- Upper Palaeolithic (PDF)
- Epipalaeolithic (PDF)
- Early Mesolithic (PDF)
- Late Mesolithic (PDF)
- Neolithic and hunter-gatherer pottery (PDF)
- Early Eneolithic (PDF)
- Late Eneolithic (PDF)
- Early Chalcolithic (PDF)
- Late Chalcolithic (PDF)
- Early Bronze Age (PDF)
- Middle Bronze Age (PDF)
- Late Bronze Age (PDF)
- Early Iron Age (PDF)
- Late Iron Age (PDF)
- Antiquity (PDF)
- Middle Ages (PDF)
mtDNA + culture maps
Colours have been assigned randomly to each macro-haplogroup.
- Anatomically Modern Humans (PDF)
- Upper Palaeolithic (PDF)
- Epipalaeolithic (PDF)
- Early Mesolithic (PDF)
- Late Mesolithic (PDF)
- Neolithic and hunter-gatherer pottery (PDF)
- Early Eneolithic (PDF)
- Late Eneolithic (PDF)
- Early Chalcolithic (PDF)
- Late Chalcolithic (PDF)
- Early Bronze Age (PDF)
- Middle Bronze Age (PDF)
- Late Bronze Age (PDF)
- Early Iron Age (PDF)
- Late Iron Age (PDF)
- Antiquity (PDF)
- Middle Ages (PDF)