Inner Asian maternal genetic origin of the Avar period nomadic elite in the 7th century AD Carpathian Basin, by Csáky et al. bioRxiv (2018).
Abstract (emphasis mine):
After 568 AD the nomadic Avars settled in the Carpathian Basin and founded their empire, which was an important force in Central Europe until the beginning of the 9th century AD. The Avar elite was probably of Inner Asian origin; its identification with the Rourans (who ruled the region of today’s Mongolia and North China in the 4th-6th centuries AD) is widely accepted in the historical research.
Here, we study the whole mitochondrial genomes of twenty-three 7th century and two 8th century AD individuals from a well-characterised Avar elite group of burials excavated in Hungary. Most of them were buried with high value prestige artefacts and their skulls showed Mongoloid morphological traits.
The majority (64%) of the studied samples’ mitochondrial DNA variability belongs to Asian haplogroups (C, D, F, M, R, Y and Z). This Avar elite group shows affinities to several ancient and modern Inner Asian populations.
The genetic results verify the historical thesis on the Inner Asian origin of the Avar elite, as not only a military retinue consisting of armed men, but an endogamous group of families migrated. This correlates well with records on historical nomadic societies where maternal lineages were as important as paternal descent.
Interesting excerpts:
The mitochondrial genome sequences can be assigned to a wide range of the Eurasian haplogroups with dominance of the Asian lineages, which represent 64% of the variability: four samples belong to Asian macrohaplogroup C (two C4a1a4, one C4a1a4a and one C4b6); five samples to macrohaplogroup D (one by one D4i2, D4j, D4j12, D4j5a, D5b1), and three individuals to F (two F1b1b and one F1b1f). Each haplogroup M7c1b2b, R2, Y1a1 and Z1a1 is represented by one individual. One further haplogroup, M7 (probably M7c1b2b), was detected (sample AC20); however, the poor quality of its sequence data (2.19x average coverage) did not allow further analysis of this sample.
European lineages (occurring mainly among females) are represented by the following haplogroups: H (one H5a2 and one H8a1), one J1b1a1, three T1a (two T1a1 and one T1a1b), one U5a1 and one U5b1b (Table S1).
We detected two identical F1b1f haplotypes (AC11 female and AC12 male) and two identical C4a1a4 haplotypes (AC13 and AC15 males) from the same cemetery of Kunszállás; these matches indicate the maternal kinship of these individuals. There is no chronological difference between the female and the male from Grave 30 and 32 (AC11 and AC12), but the two males buried in Grave 28 and 52 (AC13 and AC15) are not contemporaries; they lived at least 2-3 generations apart.
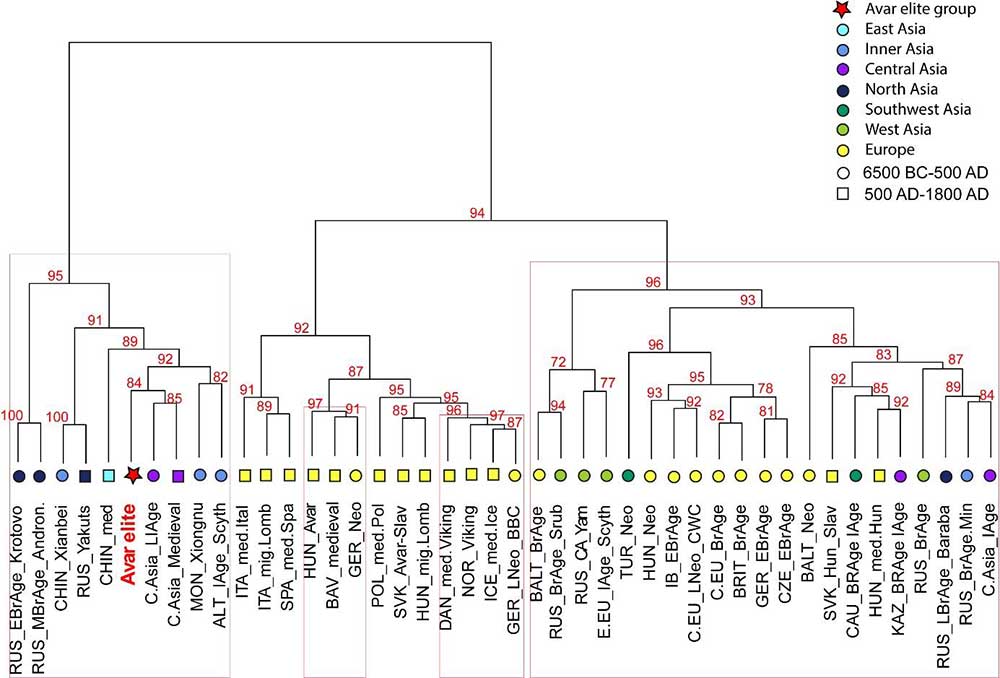
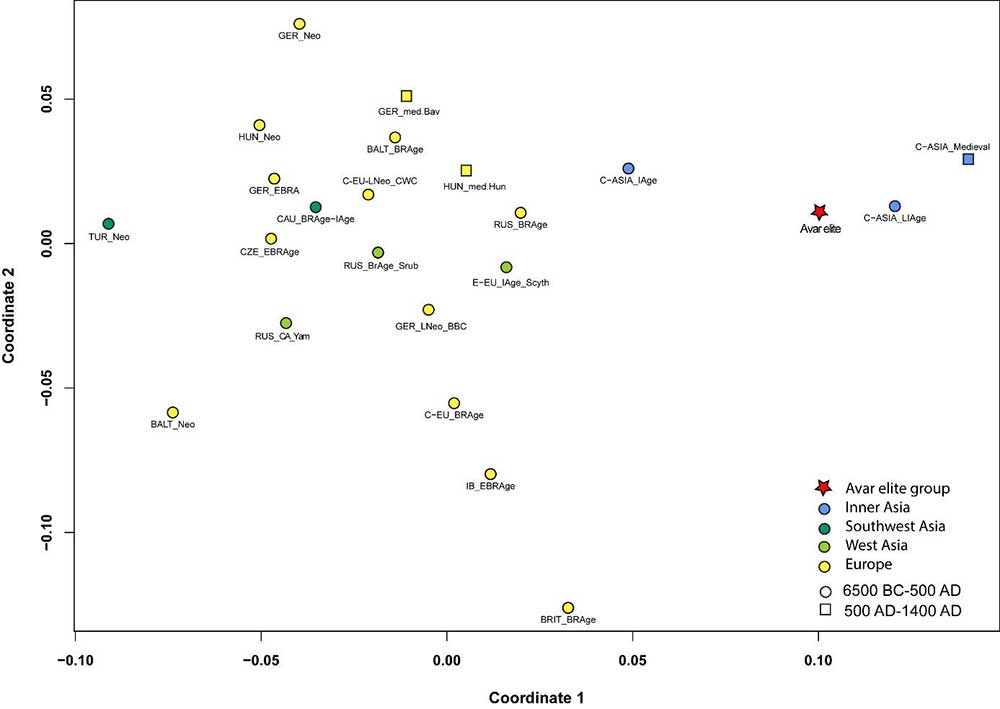
The Avar period elite shows the lowest and non-significant genetic distances to ancient Central Asian populations dated to the Late Iron Age (Hunnic) and to the Medieval period, which is displayed on the ancient MDS plot (Fig. 4); these connections are also reflected on the haplogroup based Ward-type clustering tree (Fig. 3). Building of these large Central Asian sample pools is enabled by the small number of samples per cultural/ethnic group. Further mitogenomic data from Inner Asia are needed to specify the ancient genetic connections; however, genomic analyses are also set back by the state of archaeological research, i.e. the lack of human remains from the 4th-5th century Mongolia, which would be a particularly important region in the study of the Avar elite’s origin.
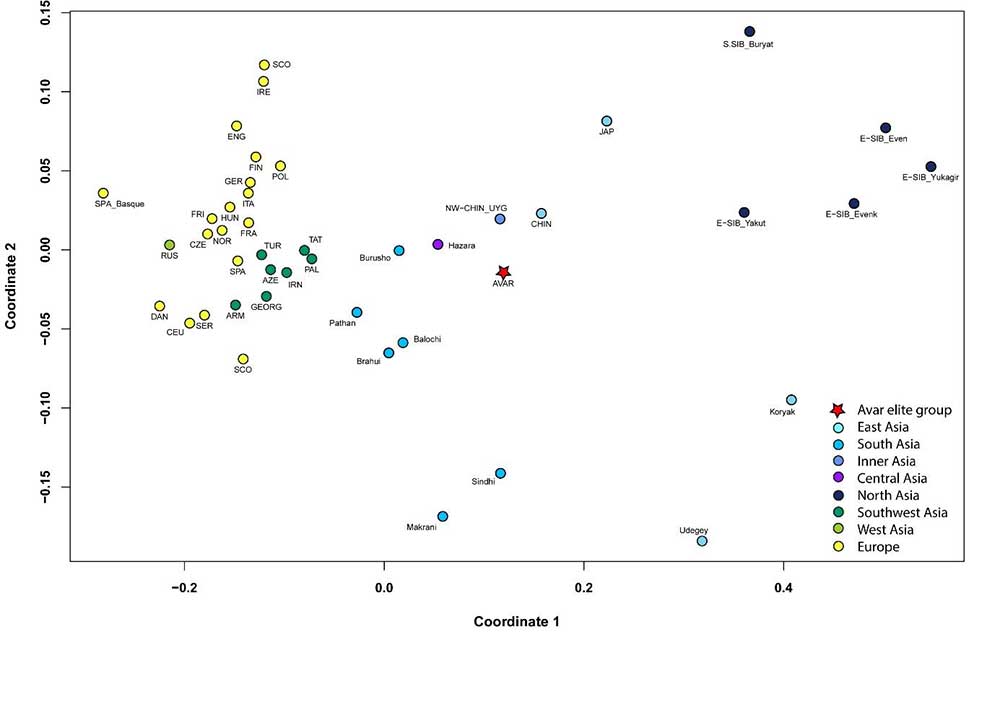
The investigated elite group from the Avar period elite also shows low genetic distances and phylogenetic connections to several Central and Inner Asian modern populations. Our results indicate that the source population of the elite group of the Avar Qaganate might have existed in Inner Asia (region of today’s Mongolia and North China) and the studied stratum of the Avars moved from there westwards towards Europe. Further genetic connections of the Avars to modern populations living to East and North of Inner Asia (Yakuts, Buryats, Tungus) probably indicate common source populations.
Sadly, no Y-DNA is available from this paper, although haplogroups Q, C2, or R1b (xM269) are probably to be expected, given the reported mtDNA. A replacement of the male population with subsequent migrations is obvious from the current distribution of Y-DNA haplogroups in the Carpathian Basin.
Hungarians and Corded Ware
Ancient Hungarians are important to understand the evolution, not only of Ugric, but also of Finno-Ugric peoples and their origin, since they show a genetic picture before more recent population expansions, genetic drift, and bottlenecks in eastern Europe.
By now it is evident that the migration of Magyar clans from their homeland in the Cis-Urals region (from the 4th century AD on) happened after the first waves of late and gradual expansion of N1c subclades among Finno-Ugric peoples, but before the bottlenecks seen in modern populations of eastern Europe.
In Ob-Ugric peoples, from the scarce data found in Pimenoff et al. (2018), we can see how Siberian N subclades expanded further after the separation of Magyars, evidenced by the inverted proportion of haplogroups R1a and N in modern Khantys and Mansis compared to Hungarians, and the diversity of N subclades compared to modern Fennic peoples.
Similarly to Hungarians, the situation of modern Estonians (where R1a and N subclades show approximately the same proportion, ca. 33%) is probably closer to Fennic peoples in Antiquity, not having undergone the latest strong founder effect evident in modern Finns after their expansion to the north.
Modern Hungary
This is data from recent papers, summed up in Wikipedia:
- In Semino et al. (2001) they found among 45 Palóc from Budapest and northern Hungary: 60% R1a, 13% R1b, 11% I, 9% E, 2% G, 2% J2.
- In Csányi et al. (2008) Among 100 Hungarian men, 90 of whom from the Great Hungarian Plain: 30% R1a, 15% R1b, 13% I2a1, 13% J2, 9% E1b1b1a, 8% I1, 3% G2, 3% J1, 3% I*, 1% E*, 1% F*, 1% K*. Among 97 Székelys, in Romania: 20% R1b, 19% R1a, 17% I1, 11% J2, 10% J1, 8% E1b1b1a, 5% I2a1, 5% G2, 3% P*, 1% E*, 1% N.
- In Pamjav et al. (2011), among 230 samples expected to include 6-8% Gypsy peoples: 26% R1a, 20% I2a, 19% R1b, 7% I, 6% J2, 5% H, 5% G2a, 5% E1b1b1a1, 3% J1, <1% N, <1% R2.
- In Pamjav et al. (2017), from the Bodrogköz population: R1a-M458 (20.4%), I2a1-P37 (19%), R1b-M343 (15%), R1a-Z280 (14.3%), E1b-M78 (10.2%), and N1c-Tat (6.2%).
NOTE. The N1c-Tat found in Bodrogköz belongs to the N1c-VL29 subgroup, more frequent among Balto-Slavic peoples, which may suggest (yet again) an initial stage of the expansion of N subclades among Finno-Ugric peoples by the time of the Hungarian migration.
This is the data from FTDNA group on Hungary (copied from a Wikipedia summary of 2017 data):
- 26.1% R1a (15% Z280, 6.5% M458, 0.9% Z93=>S23201, 3.7% unknown)
- 19.2% R1b (6% L11-P312/U106, 5.3% P312, 4.2% L23/Z2103, 3.7% U106)
- 16.9% I2 (15.2% CTS10228, 1.4% M223, 0.5% L38)
- 8.3% I1
- 8.1% J2 (5.3% M410, 2.8% M102)
- 6.9% E1b1b1 (6% V13, 0.3% V22, 0.3% M123, 0.3% M81)
- 6.9% G2a
- 3.2% N (1.4% Z9136, 0.5% M2019/VL67, 0.5% Y7310, 0.9% Z16981)- note: only unrelated males are sampled
- 2.3% Q (1.2% YP789, 0.9% M346, 0.2% M242)
- 0.9% T
- 0.5% J1
- 0.2% L
- 0.2% C
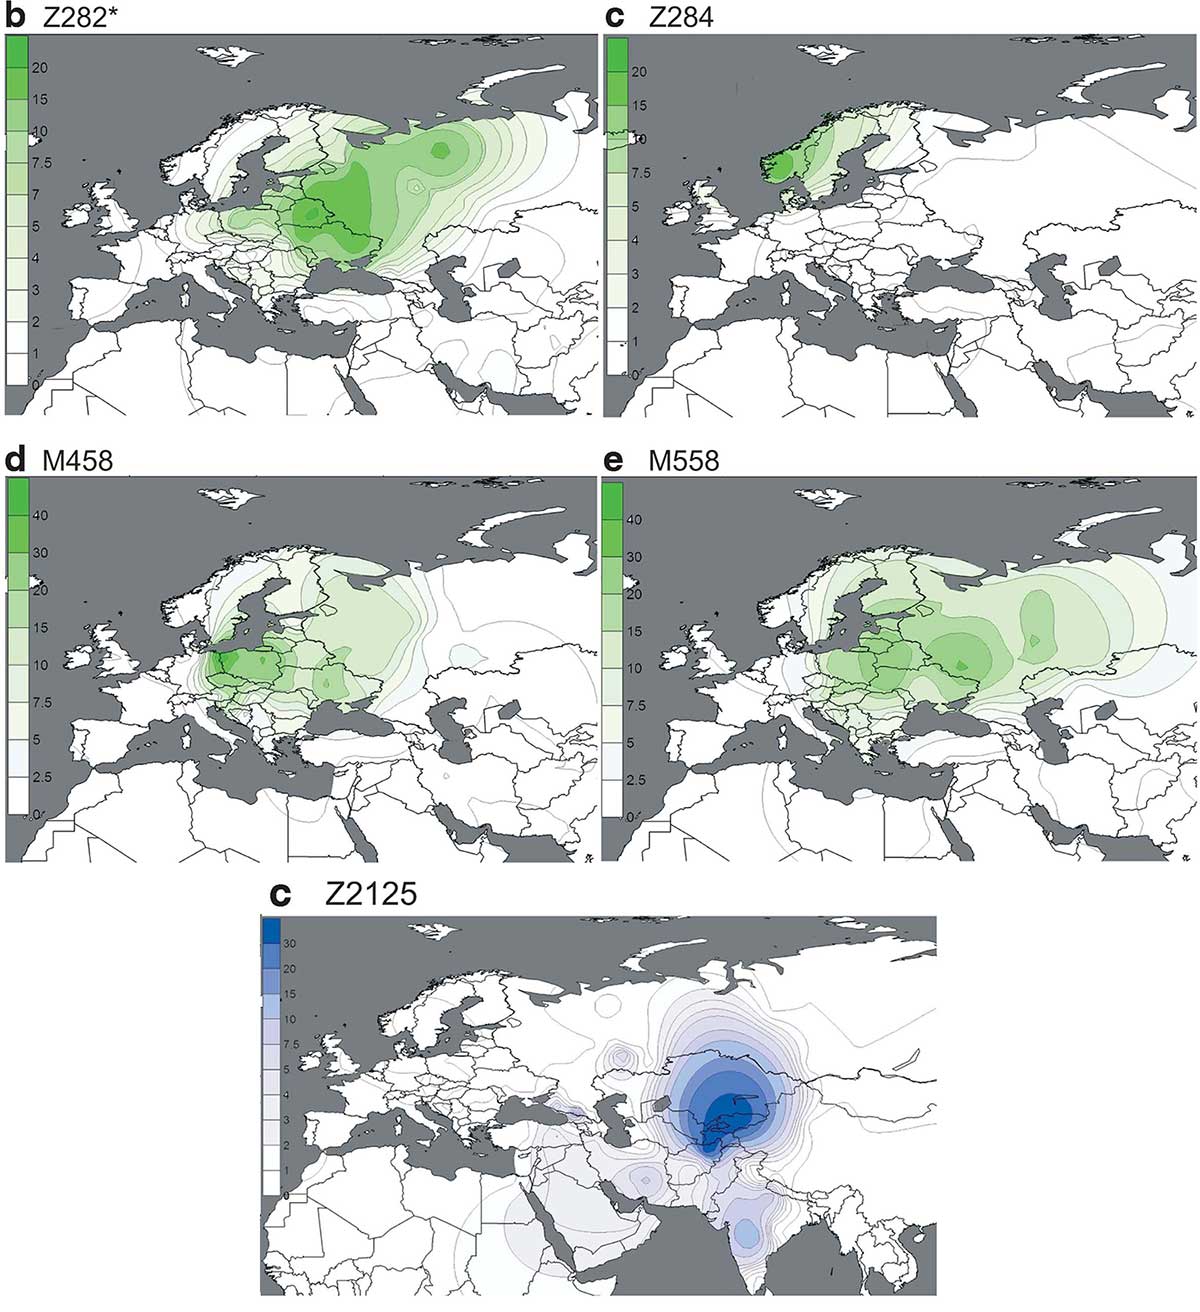
R1a-Z280 stands out in FDNA (which we have to assume has no geographic preference among modern Hungarians), while R1a-M458 is prevalent in the north, which probably points to its relationship with (at least West) Slavic populations.
Ancient Hungarians
We already knew that Hungarians show similarities with Srubna and Hunnic peoples, and this paper shows a good reason for the similarities with the Huns.
Also, recent population movements in the region (before the Avars) probably increased the proportion of R1b-L23 and I1 subclades (related to Roman and Germanic peoples) as well as possibly R1a-Z283 (mainly M458, related to the expansion of Slavs). From Understanding 6th-century barbarian social organization and migration through paleogenomics, by Amorim et al. (2018):
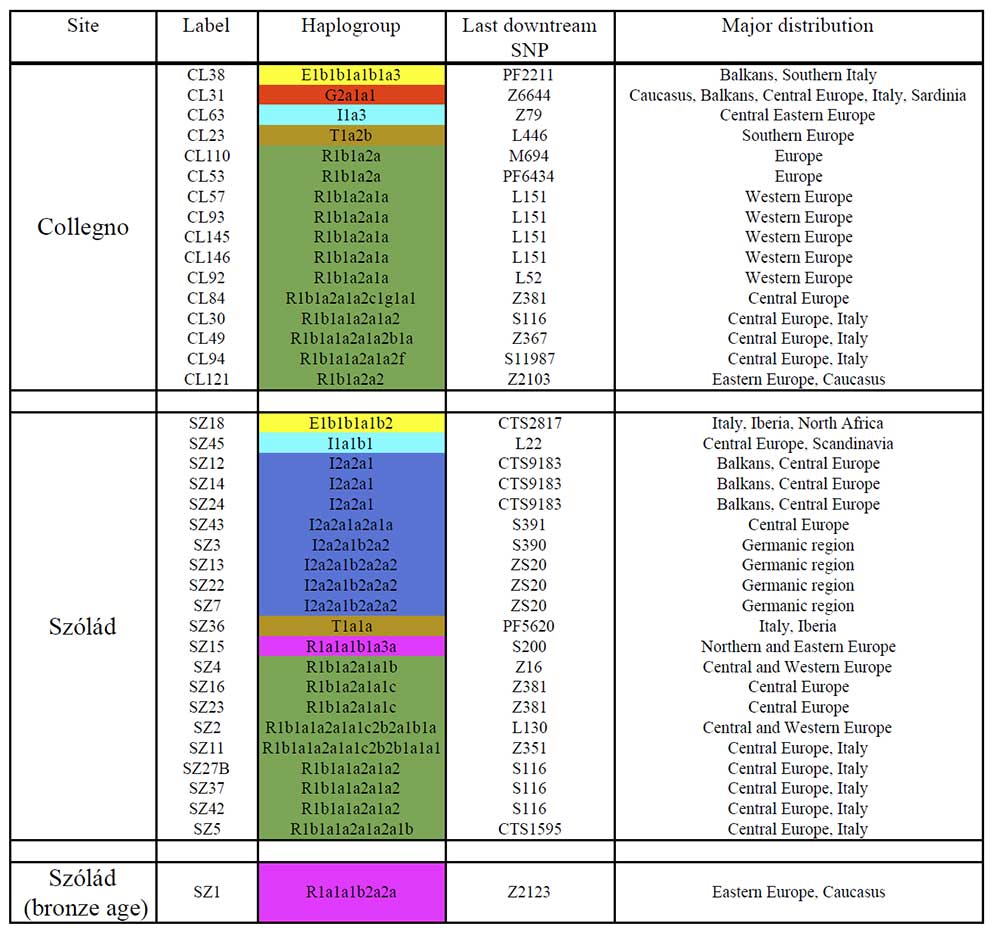
NOTE. The sample SZ15, of haplogroup R1a1a1b1a3a (S200), belongs to the Germanic branch Z284, which has a completely different history with its integration into the Nordic Bronze Age community.
Interesting is the Szólád Bronze Age sample of R1a1a1b2a2a (Z2123) subclade (ca. 2100-1700 BC), which is possibly the same haplogroup found in King Béla III [Z93+ (80.6%), Z2123+ (10.8%)]*. Nevertheless, Z2123 refers to an upper clade, found also in East Andronovo sites in Narasimhan et al. (2018), as well as in the modern population of the Tarim Basin.
NOTE. For more on the analysis of probability of the actual subclade, see here.
Bronze Age R1a-Z93 samples of central-east Europe – like the Balkans BA sample (ca. 1750-1625 BC) from Merichleri, of R1a1a1b2 subclade – correspond most likely to the expansion of Iranian-speaking peoples in the early 2nd millennium BC, probably to the westward expansion of the Srubna culture.
The specific subclade of King Béla III, on the other hand, probably corresponds to the more recent expansion of Magyar tribes settled in the region during the 9th century AD, so the specific subclade must have separated from those found in central-east Europe and in Andronovo during the Corded Ware expansion.
The study by Csányi et al. (2008), where the Tat C allele was found in 2 of 4 ancient samples, showed thus a potential 50:50 relationship of N1c in ancient Magyars, which is striking given the modern 1-3% a mere 1,000 years later, without any relevant population movement in between. This result remains to be reproduced with the current technology.
In fact, recent studies of ancient Magyars, from the 10th to the 12th century, have not shown any N1c sample, and have confirmed instead the ancient presence of R1a (two other samples, interred near Béla III), R1b (four samples), I2a (two samples) J1, and E1b, a mixed genetic picture which is more in line with what is expected.
So the question that I recently posed about east Corded Ware groups remains open: were Proto-Ugric peoples mainly of R1a-Z282 or R1a-Z93 subclades? Without ancient DNA from Middle Dnieper, Fatyanovo, Afanasevo, and the succeeding cultures (like Netted Ware) in north-eastern Europe, it is difficult to say.
It is very likely that they are going to show mainly a mixture of both R1a-Z282 and R1a-Z93 lineages, with later populations showing a higher proportion of R1a-Z280 subclades. Whether this mixture happened already during the Corded Ware period, or is the result of later developments, is still unknown. What is certain is that Hungarian N1a1a1a-L708 subclades belong to more recent additions of Siberian haplogroups to the Ugric stock, probably during the Iron Age, just centuries before the Magyar expansion.
Related
- On the origin and spread of haplogroup R1a-Z645 from eastern Europe
- Hungarian mitogenomes similar to East and West Slavs, but genetic substratum predates their historic contacts
- First Hungarian ruling dynasty, the Árpáds, of Y-DNA haplogroup R1a
- Admixture of Srubna and Huns in Hungarian conquerors
- Modern Hungarian mtDNA more similar to ancient Europeans than to Hungarian conquerors
- Oldest N1c1a1a-L392 samples and Siberian ancestry in Bronze Age Fennoscandia
- Consequences of Damgaard et al. 2018 (III): Proto-Finno-Ugric & Proto-Indo-Iranian in the North Caspian region
- The concept of “Outlier” in Human Ancestry (III): Late Neolithic samples from the Baltic region and origins of the Corded Ware culture
- Genetic prehistory of the Baltic Sea region and Y-DNA: Corded Ware and R1a-Z645, Bronze Age and N1c
- More evidence on the recent arrival of haplogroup N and gradual replacement of R1a lineages in North-Eastern Europe
- Another hint at the role of Corded Ware peoples in spreading Uralic languages into north-eastern Europe, found in mtDNA analysis of the Finnish population
- New Ukraine Eneolithic sample from late Sredni Stog, near homeland of the Corded Ware culture