Interesting excerpts (emphasis mine, modified for clarity):
To understand the genetic structure and influence of the Viking expansion, we sequenced the genomes of 442 ancient humans from across Europe and Greenland ranging from the Bronze Age (c. 2400 BC) to the early Modern period (c. 1600 CE), with particular emphasis on the Viking Age. We find that the period preceding the Viking Age was accompanied by foreign gene flow into Scandinavia from the south and east: spreading from Denmark and eastern Sweden to the rest of Scandinavia. Despite the close linguistic similarities of modern Scandinavian languages, we observe genetic structure within Scandinavia, suggesting that regional population differences were already present 1,000 years ago.
Maps illustrating the following texts have been made based on data from this and other papers:
Maps showing ancestry include only data from this preprint (which also includes some samples from Sigtuna).
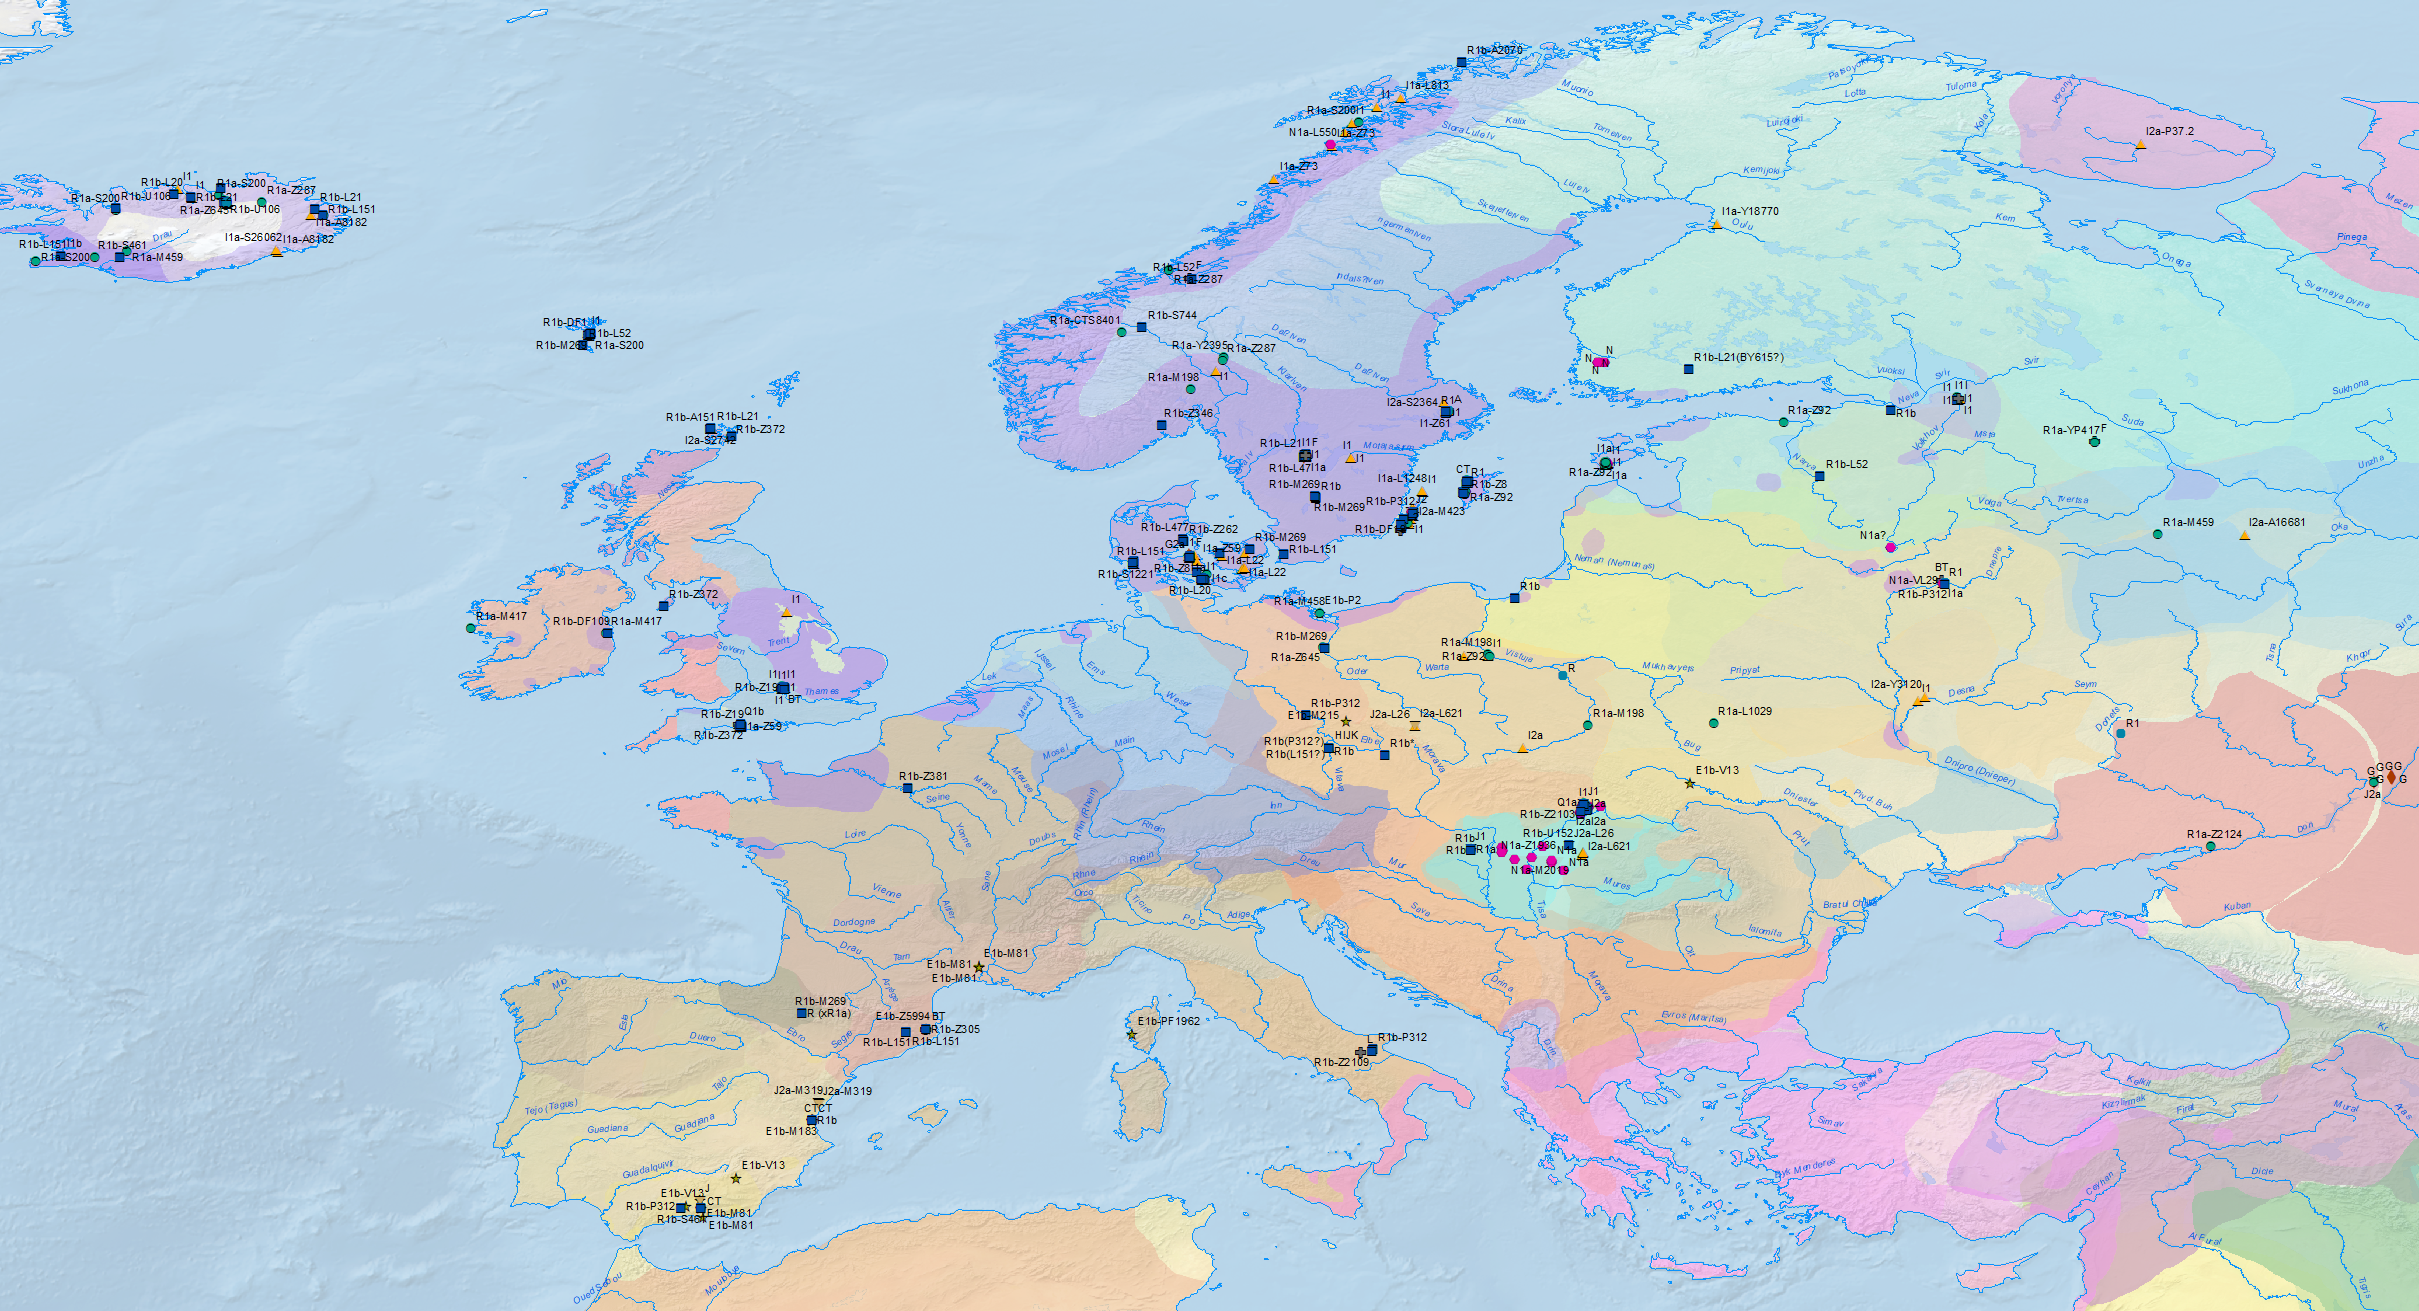
Maps showing haplogroups of ancient DNA samples based on their age include data from all published papers, but with slightly modified locations to avoid overcrowding (randomized distance approx. ± 0.1 long. and lat.).
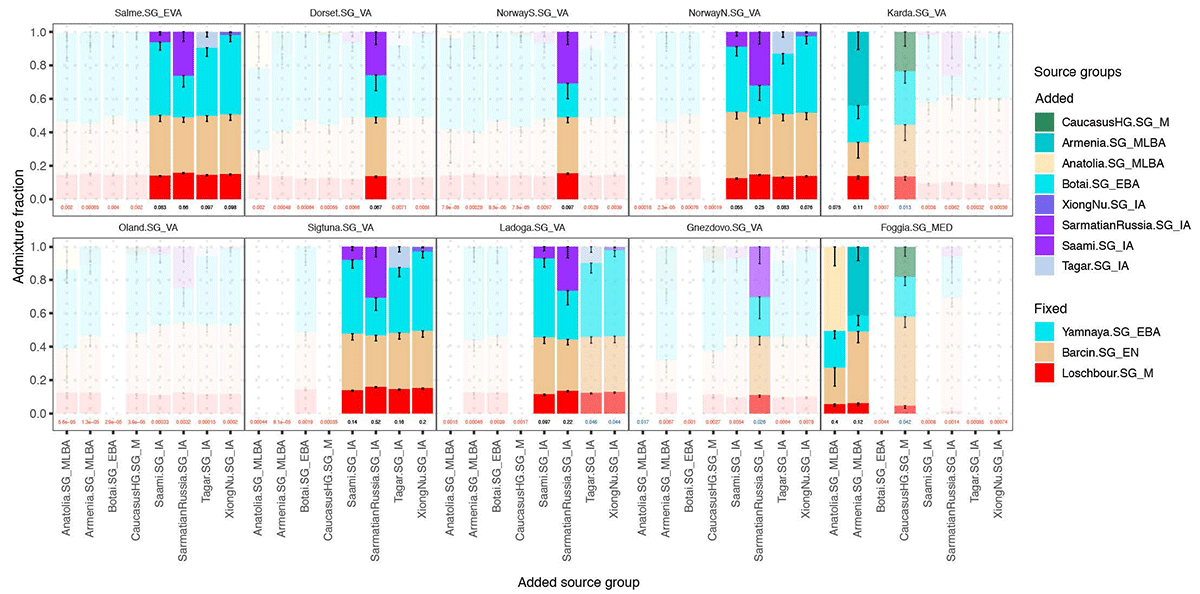
We find that the transition from the BA to the IA is accompanied by a reduction in Neolithic farmer ancestry, with a corresponding increase in both Steppe-like ancestry and hunter-gatherer ancestry. While most groups show a slight recovery of farmer ancestry during the VA, there is considerable variation in ancestry across Scandinavia. In particular, we observe a wide range of ancestry compositions among individuals from Sweden, with some groups in southern Sweden showing some of the highest farmer ancestry proportions (40% or more in individuals from Malmö, Kärda or Öland).
Ancestry proportions in Norway and Denmark on the other hand appear more uniform. Finally we detect an influx of low levels of “eastern” ancestry starting in the early VA, mostly constrained among groups from eastern and central Sweden as well as some Norwegian groups. Testing of putative source groups for this “eastern” ancestry revealed differing patterns among the Viking Age target groups, with contributions of either East Asian- or Caucasus-related ancestry.
Ancestry proportions of four-way models including additional putative source groups for target groups for which three-way fit was rejected (p ≤ 0.01);
Overall, our findings suggest that the genetic makeup of VA Scandinavia derives from mixtures of three earlier sources: Mesolithic hunter-gatherers, Neolithic farmers, and Bronze Age pastoralists. Intriguingly, our results also indicate ongoing gene flow from the south and east into Iron Age Scandinavia. Thus, these observations are consistent with archaeological claims of wide-ranging demographic turmoil in the aftermath of the Roman Empire with consequences for the Scandinavian populations during the late Iron Age.
Genetic structure within Viking-Age Scandinavia
We find that VA Scandinavians on average cluster into three groups according to their geographic origin, shifted towards their respective present-day counterparts in Denmark, Sweden and Norway. Closer inspection of the distributions for the different groups reveals additional complexity in their genetic structure.
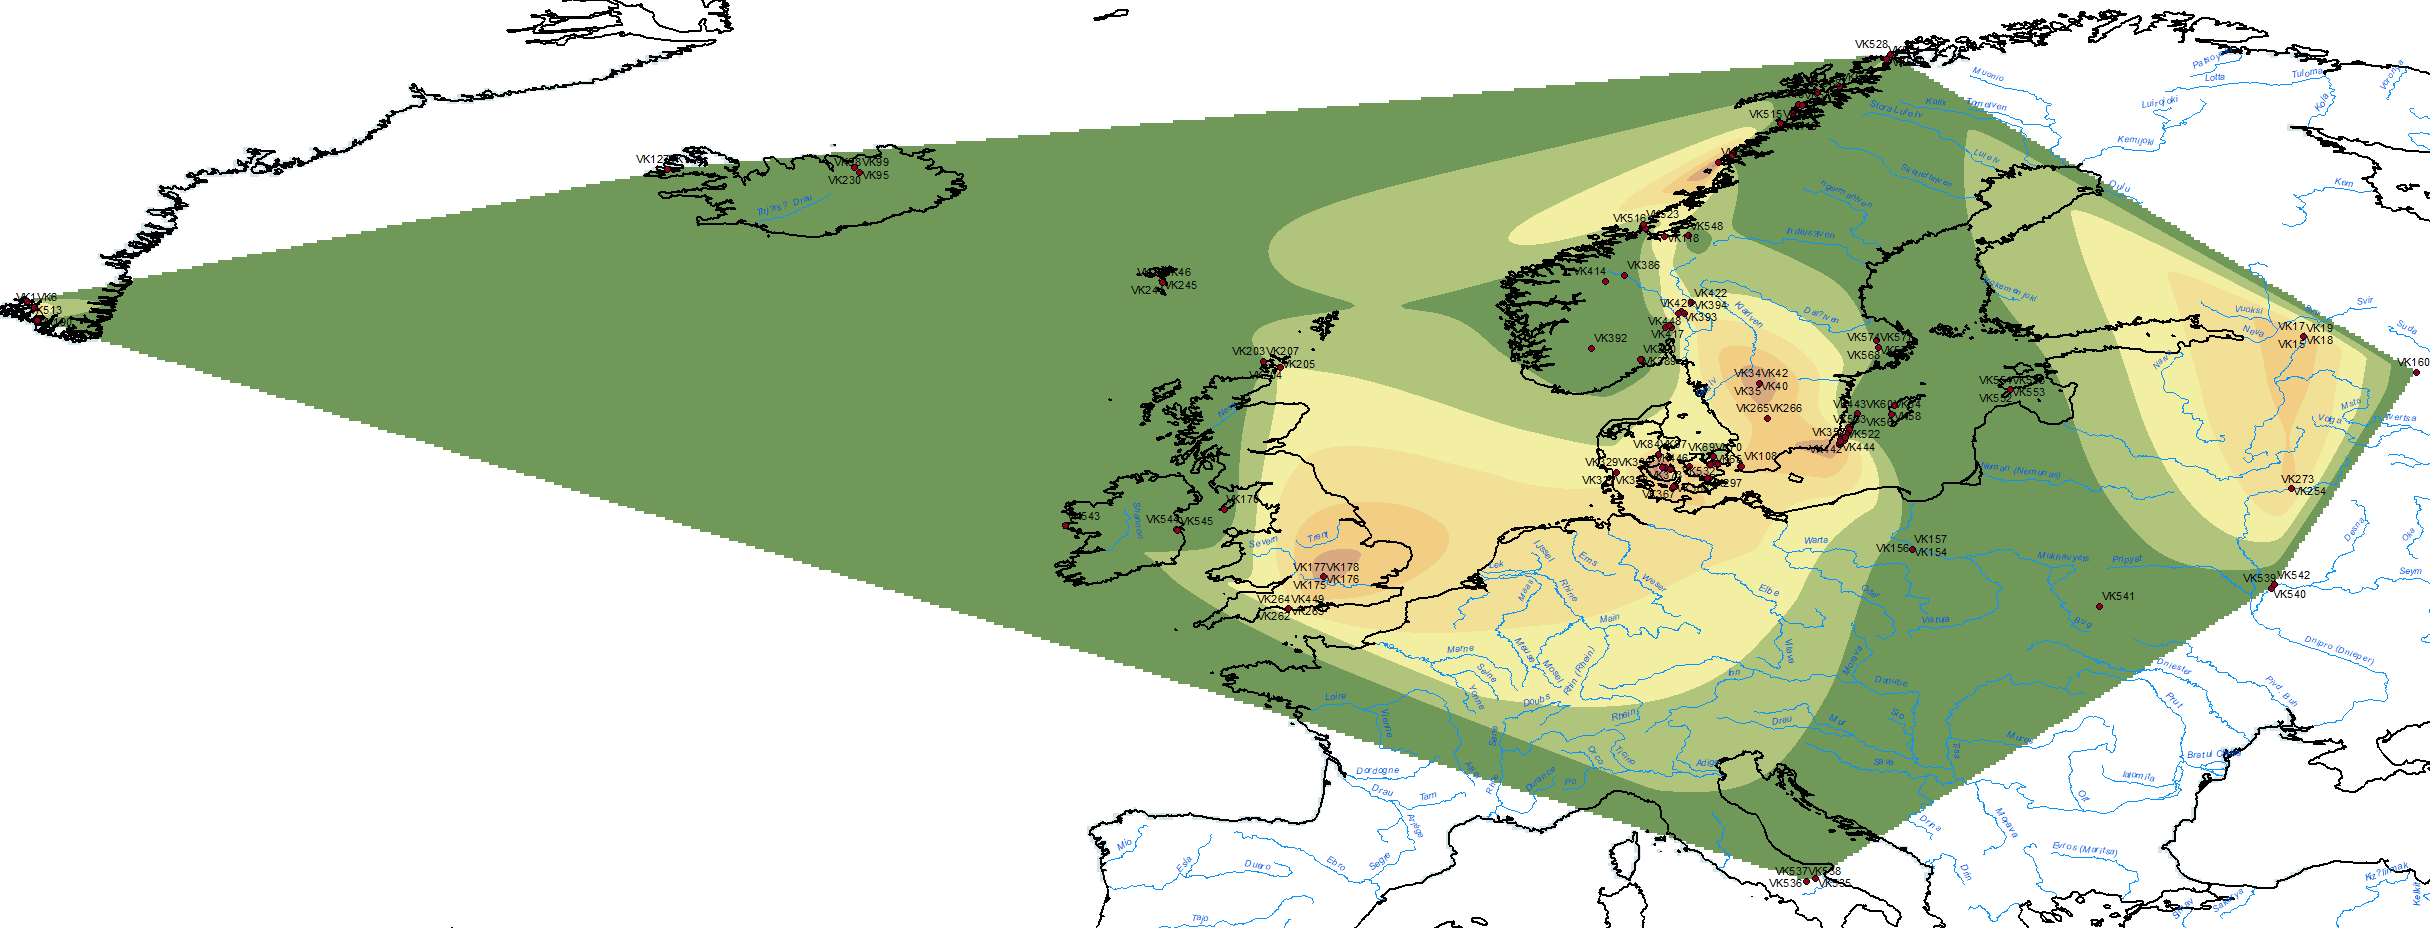
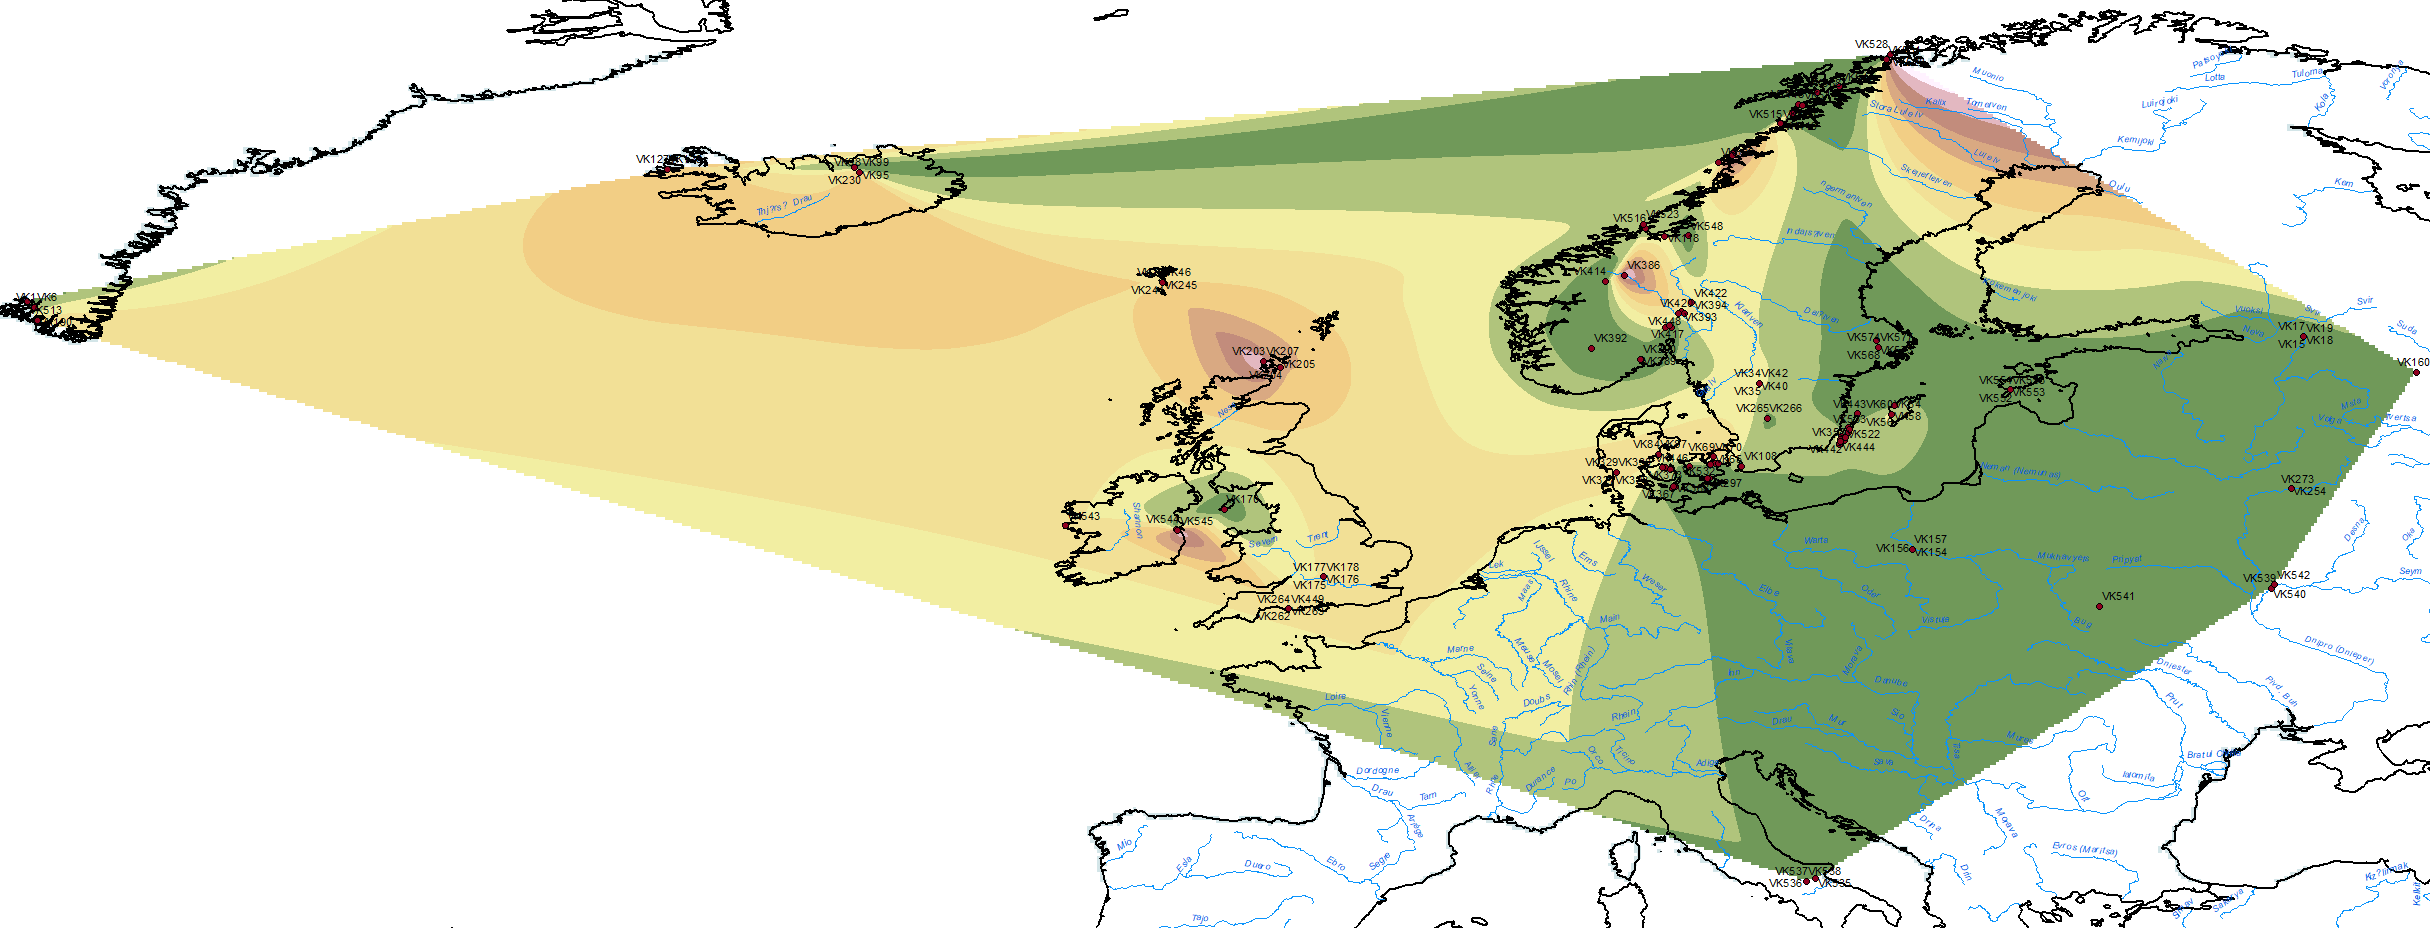
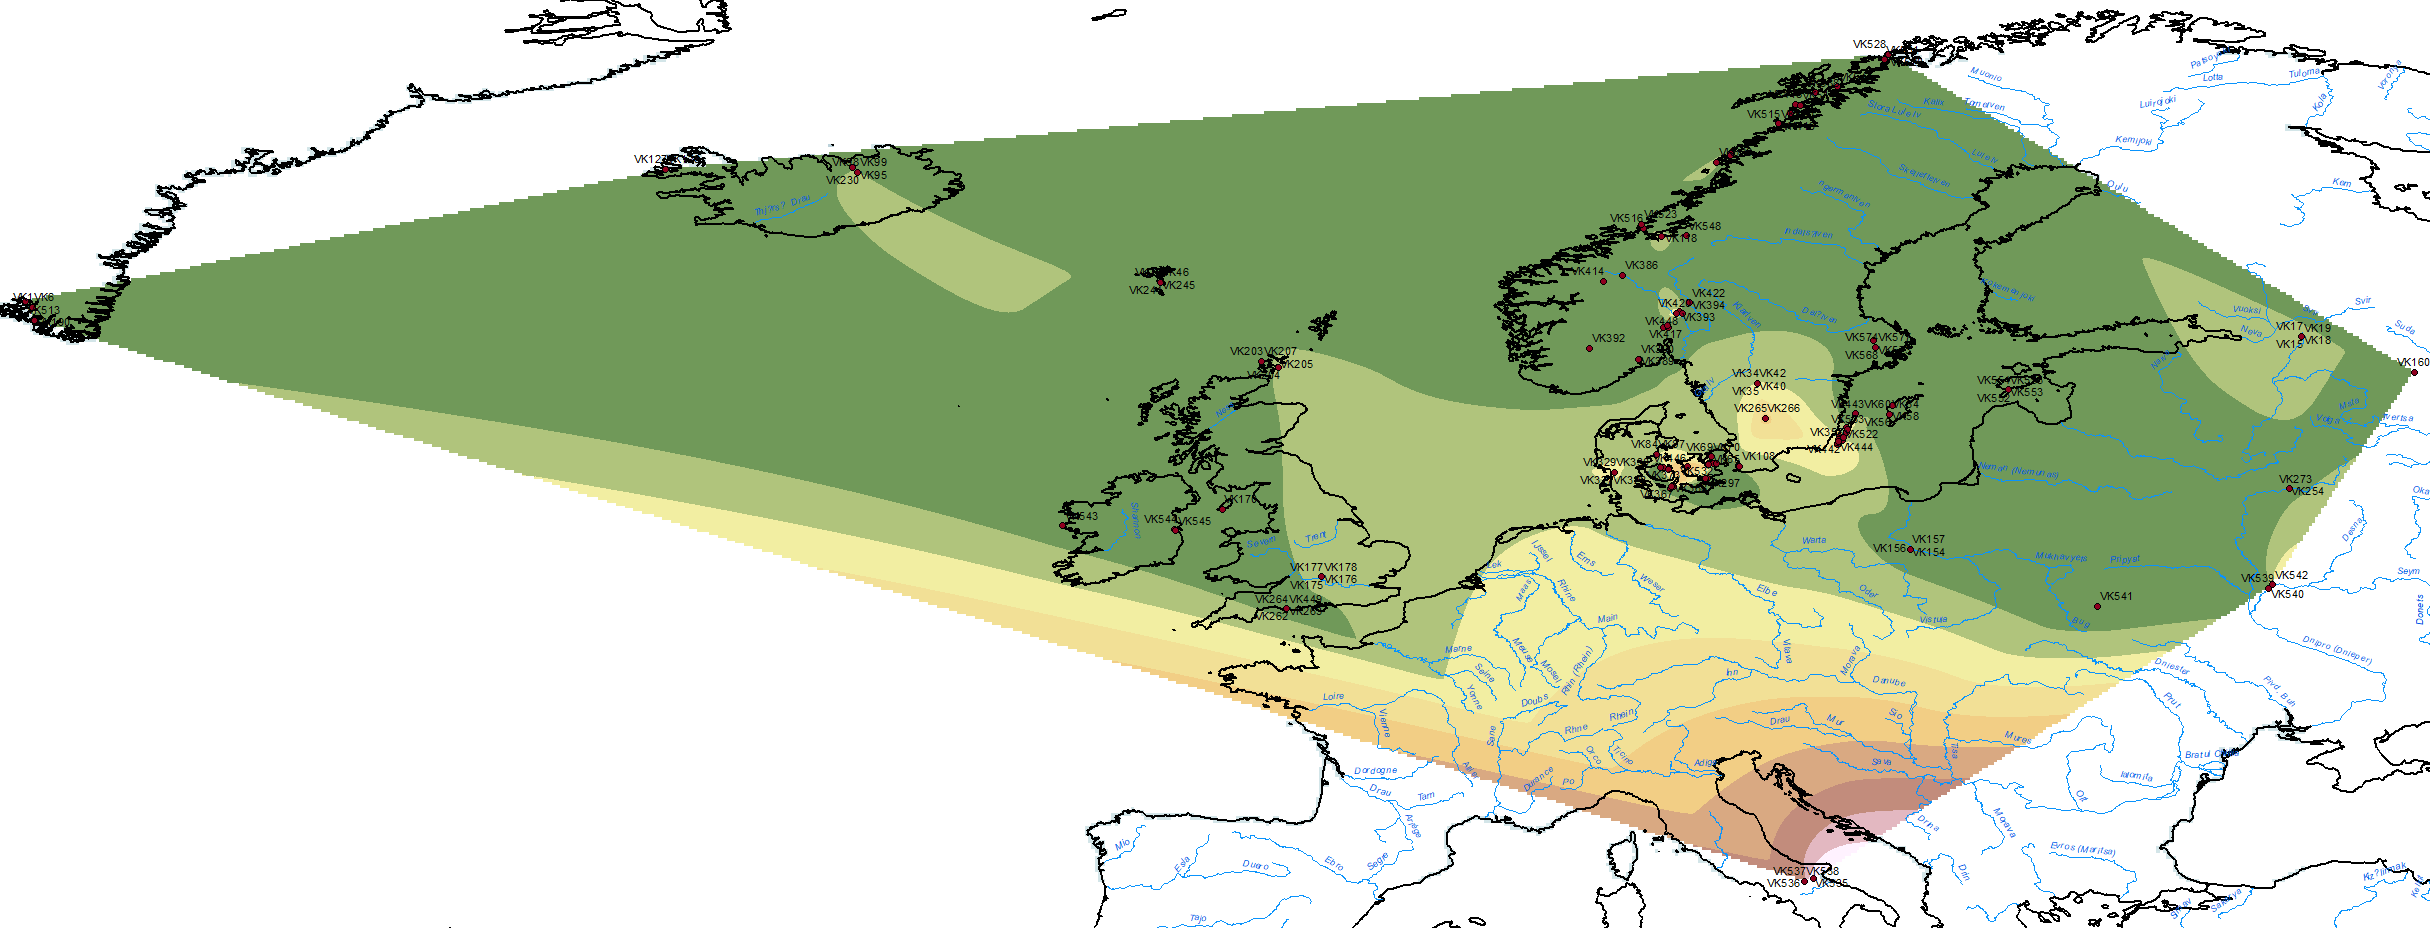
Natural neighbor interpolation of “Danish ancestry” among Vikings.
We find that the ‘Norwegian’ cluster includes Norwegian IA individuals, who are distinct from both Swedish and Danish IA individuals which cluster together with the majority of central and eastern Swedish VA individuals. Many individuals from southwestern Sweden (e.g. Skara) cluster with Danish present-day individuals from the eastern islands (Funen, Zealand), skewing towards the ‘Swedish’ cluster with respect to early and more western Danish VA individuals (Jutland).
Some individuals have strong affinity with Eastern Europeans, particularly those from the island of Gotland in eastern Sweden. The latter likely reflects individuals with Baltic ancestry, as clustering with Baltic BA individuals is evident in the IBS-UMAP analysis and through f4-statistics.
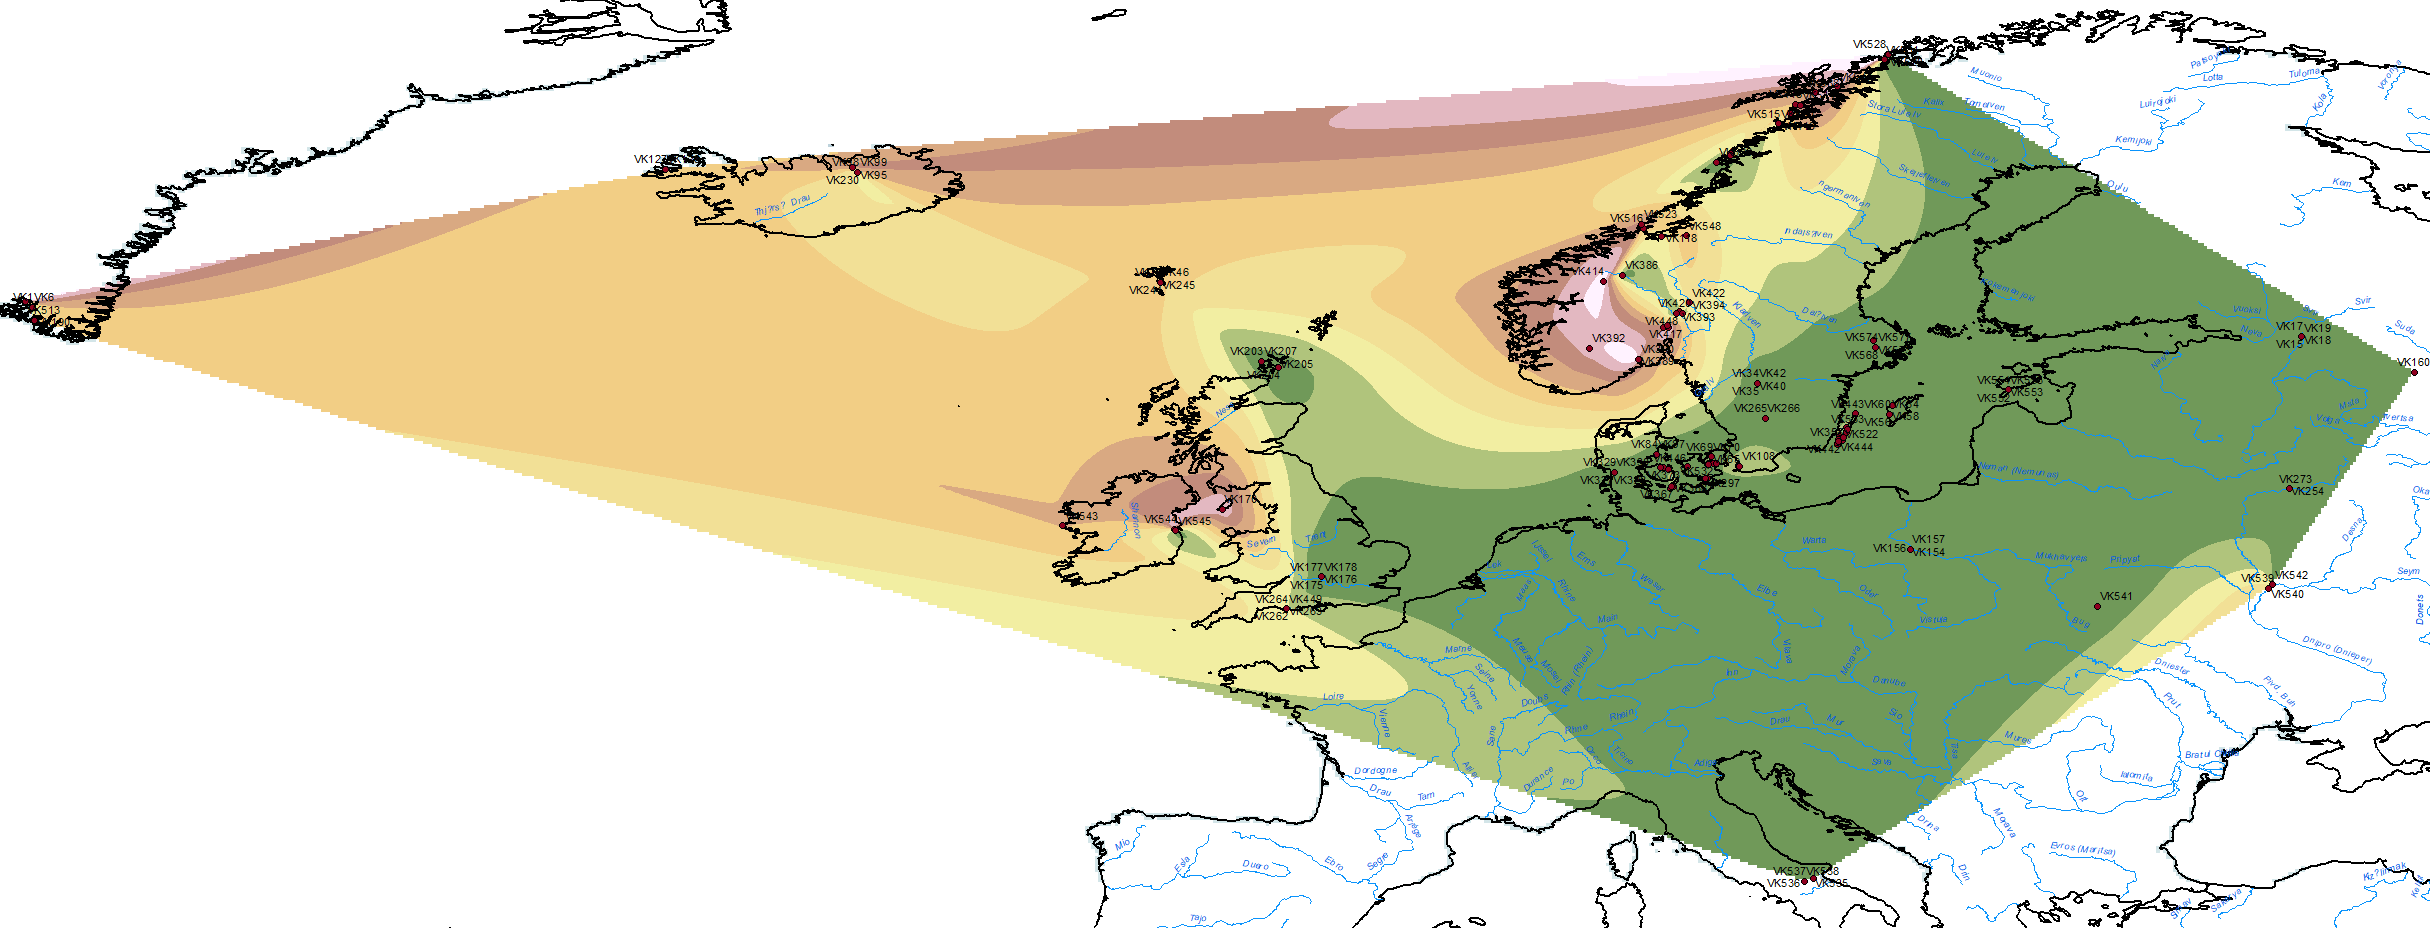
Natural neighbor interpolation of “Norwegian ancestry” among Vikings.
Genetic clustering using IBS-UMAP suggested genetic affinities of some Viking Age individuals with Bronze Age individuals from the Baltic. To further test these, we quantified excess allele sharing of Viking Age individuals with Baltic BA compared to early Viking Age individuals from Salme using f4 statistics. We find that many individuals from the island of Gotland share a significant excess of alleles with Baltic BA, consistent with other evidence of this site being a trading post with contacts across the Baltic Sea.
Natural neighbor interpolation of “Finnish ancestry” among Vikings.
The earliest N1a-VL29 sample available comes from Iron Age Gotland (VK579) ca. AD 200-400 (see Iron Age Y-DNA maps), which also proves its presence in the western Baltic before the Viking expansion. The distribution of N1a-VL29 and R1a-Z280 (compared to R1a in general) among Vikings also supports a likely expansion of both lineages in succeeding waves from the east with Akozino warrior-traders, at the same time as they expanded into the Gulf of Finland.
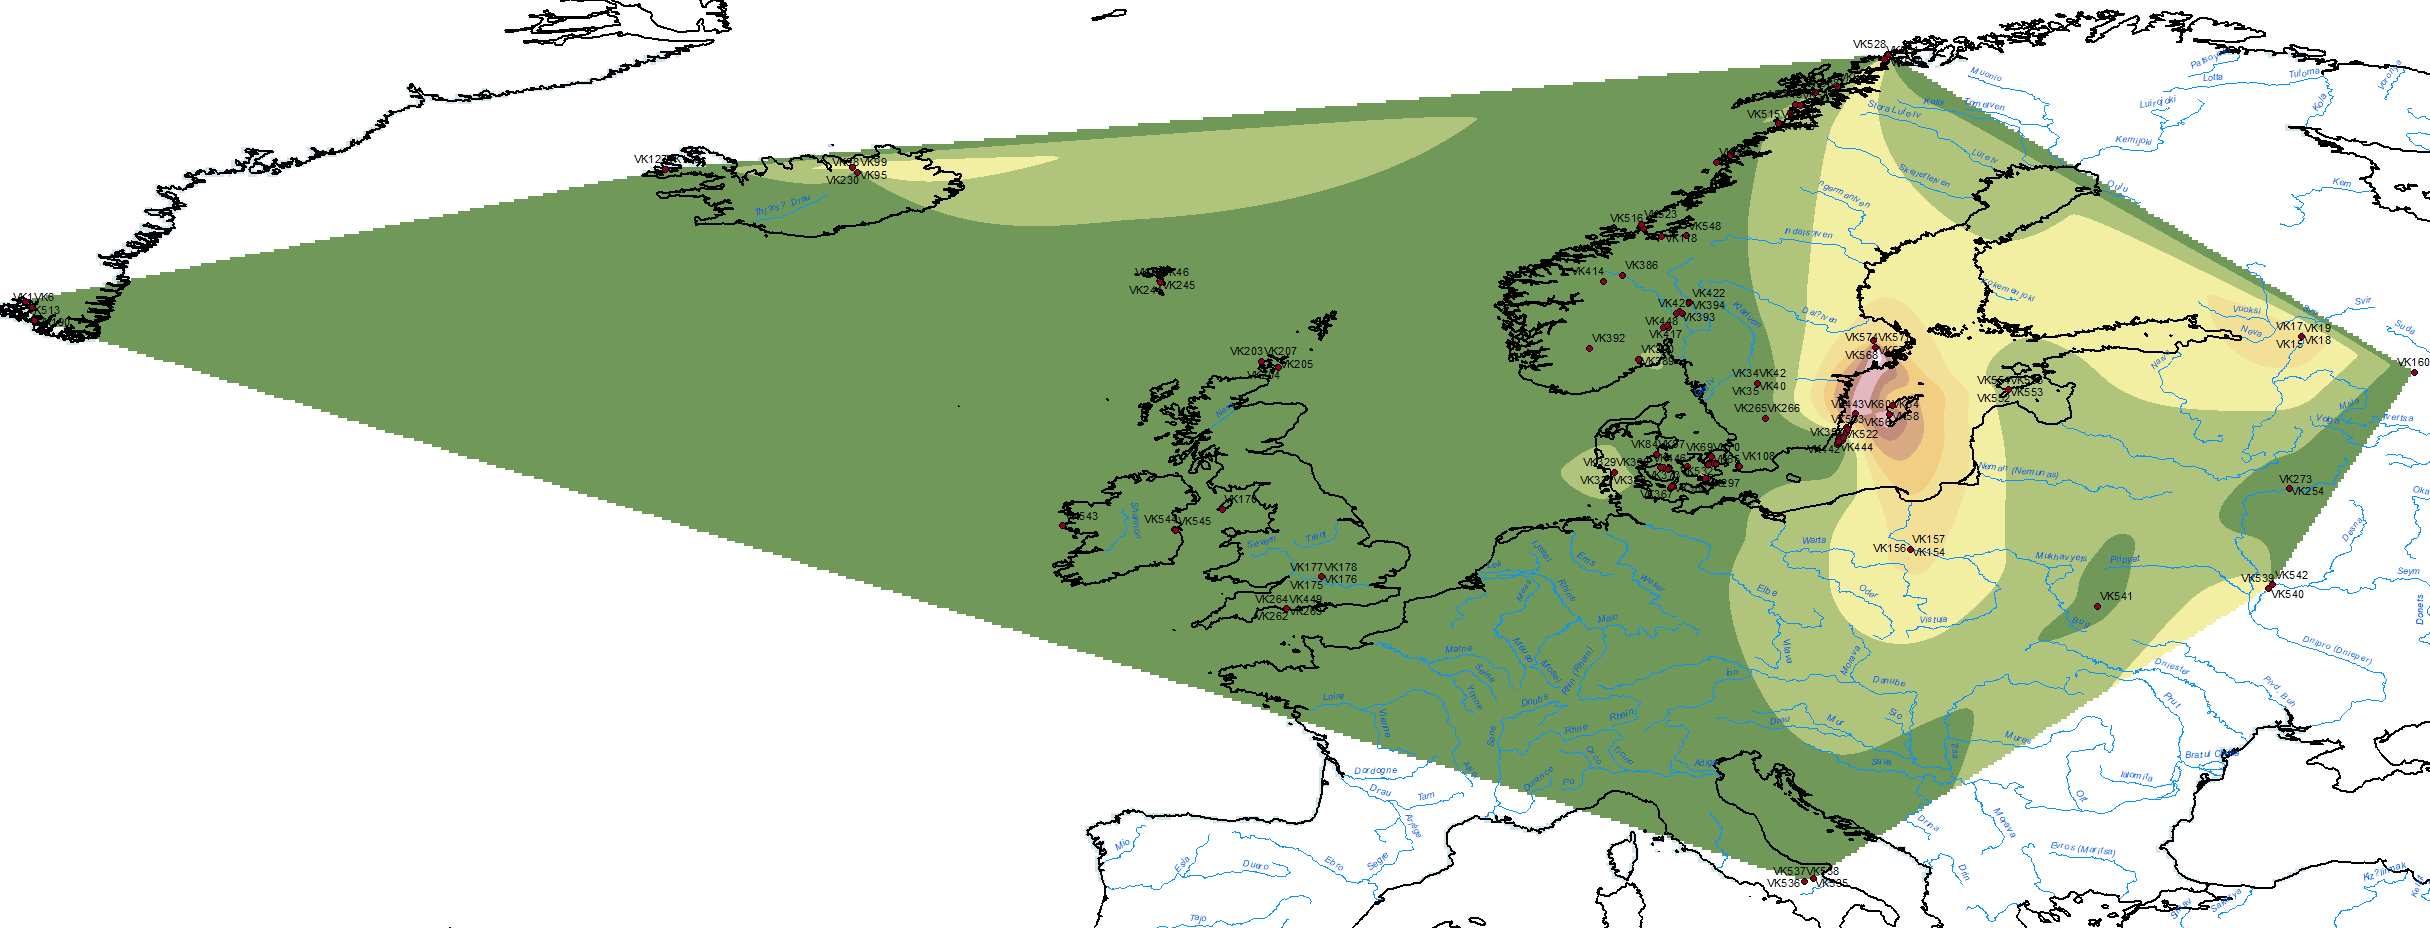
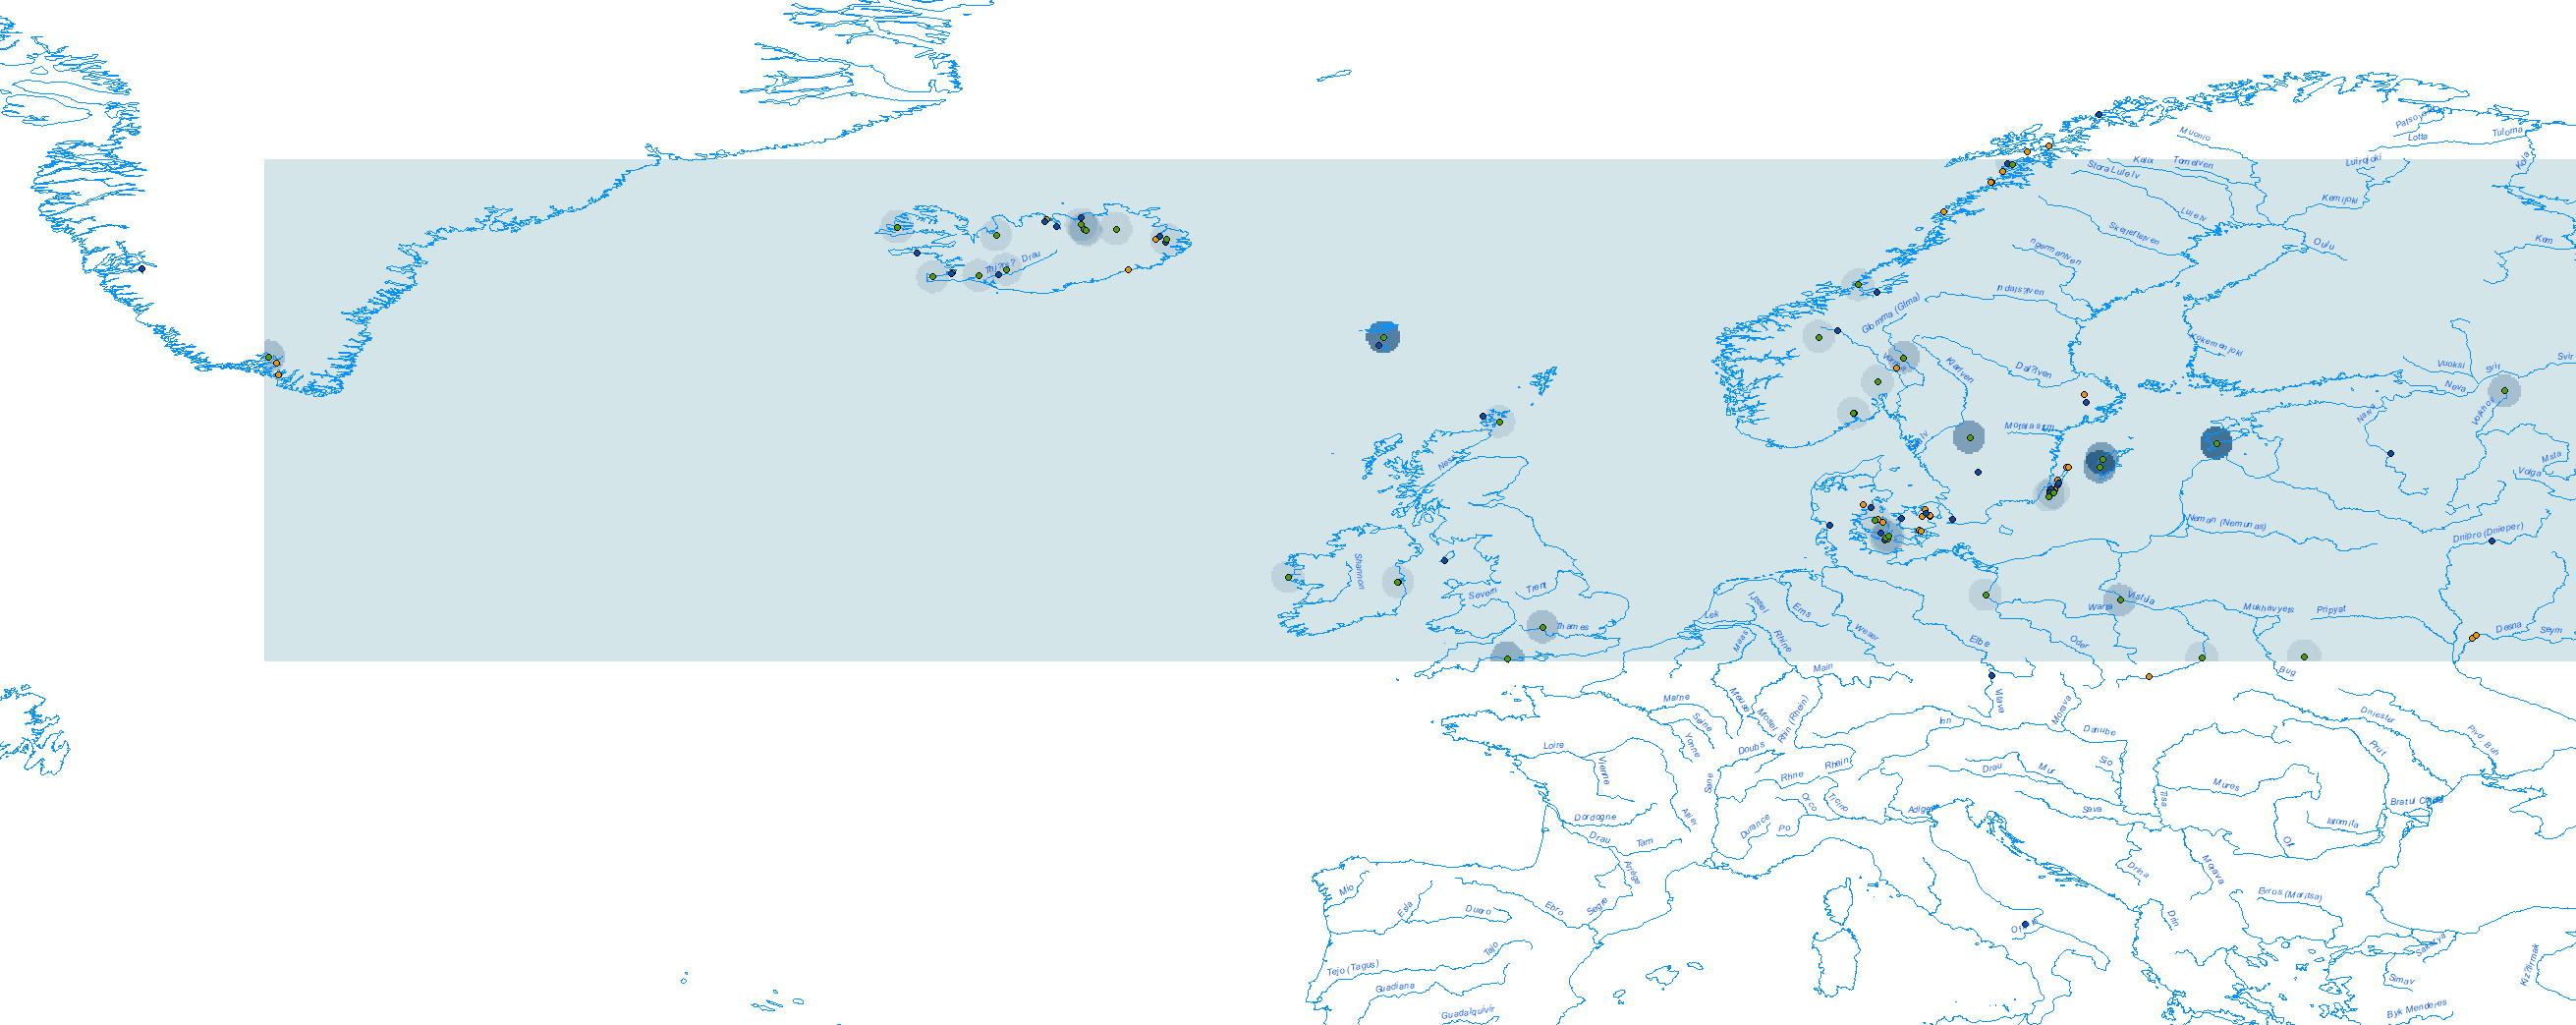
Density of haplogroup R1a-Z280 (samples in pink) overlaid over other R1a samples (in green, with R1a-Z284 in cyan) among Vikings.
Vikings in Estonia
(…) only one Viking raiding or diplomatic expedition has left direct archaeological traces, at Salme in Estonia, where 41 Swedish Vikings who died violently were buried in two boats accompanied by high-status weaponry. Importantly, the Salme boat-burial predates the first textually documented raid (in Lindisfarne in 793) by nearly half a century. Comparing the genomes of 34 individuals from the Salme burial using kinship analyses, we find that these elite warriors included four brothers buried side by side and a 3rd degree relative of one of the four brothers. In addition, members of the Salme group had very similar ancestry profiles, in comparison to the profiles of other Viking burials. This suggests that this raid was conducted by genetically homogeneous people of high status, including close kin. Isotope analyses indicate that the crew descended from the Mälaren area in Eastern Sweden thus confirming that the Baltic-Mid-Swedish interaction took place early in the VA.
Natural neighbor interpolation of “Swedish ancestry” among Vikings.
Viking samples from Estonia show thus ancient Swedes from the Mälaren area, which proves once again that hg. N1a-VL29 (especially subclade N1a-L550) and tiny proportions of so-called “Siberian ancestry” expanded during the Early Iron Age into the whole Baltic Sea area, not only into Estonia, and evidently not spreading with Balto-Finnic languages (since the language influence is in the opposite direction, east-west, Germanic > Finno-Samic, during the Bronze Age).
N1a-VL29 lineages spread again later eastwards with Varangians, from Sweden into north-eastern Europe, most likely including the ancestors of the Rurikid dynasty. Unsurprisingly, the arrival of Vikings with Swedish ancestry into the East Baltic and their dispersal through the forest zone didn’t cause a language shift of Balto-Finnic, Mordvinic, or East Slavic speakers to Old Norse, either…
NOTE. For N1a-Y4339 – N1a-L550 subclade of Swedish origin – as main haplogroup of modern descendants of Rurikid princes, see Volkov & Seslavin (2019) – full text in comments below. Data from ancient samples show varied paternal lineages even among early rulers traditionally linked to Rurik’s line, which explains some of the discrepancies found among modern descendants:
A sample from Chernihiv (VK542) potentially belonging to Gleb Svyatoslavich, the 11th century prince of Tmutarakan/Novgorod, belongs to hg. I2a-Y3120 (a subclade of early Slavic I2a-CTS10228) and has 71% “Modern Polish” ancestry (see below).
Izyaslav Ingvarevych, the 13th century prince of Dorogobuzh, Principality of Volhynia/Galicia, is probably behind a sample from Lutsk (VK541), and belongs to hg. R1a-L1029 (a subclade of R1a-M458), showing ca. 95% of “Modern Polish” ancestry.
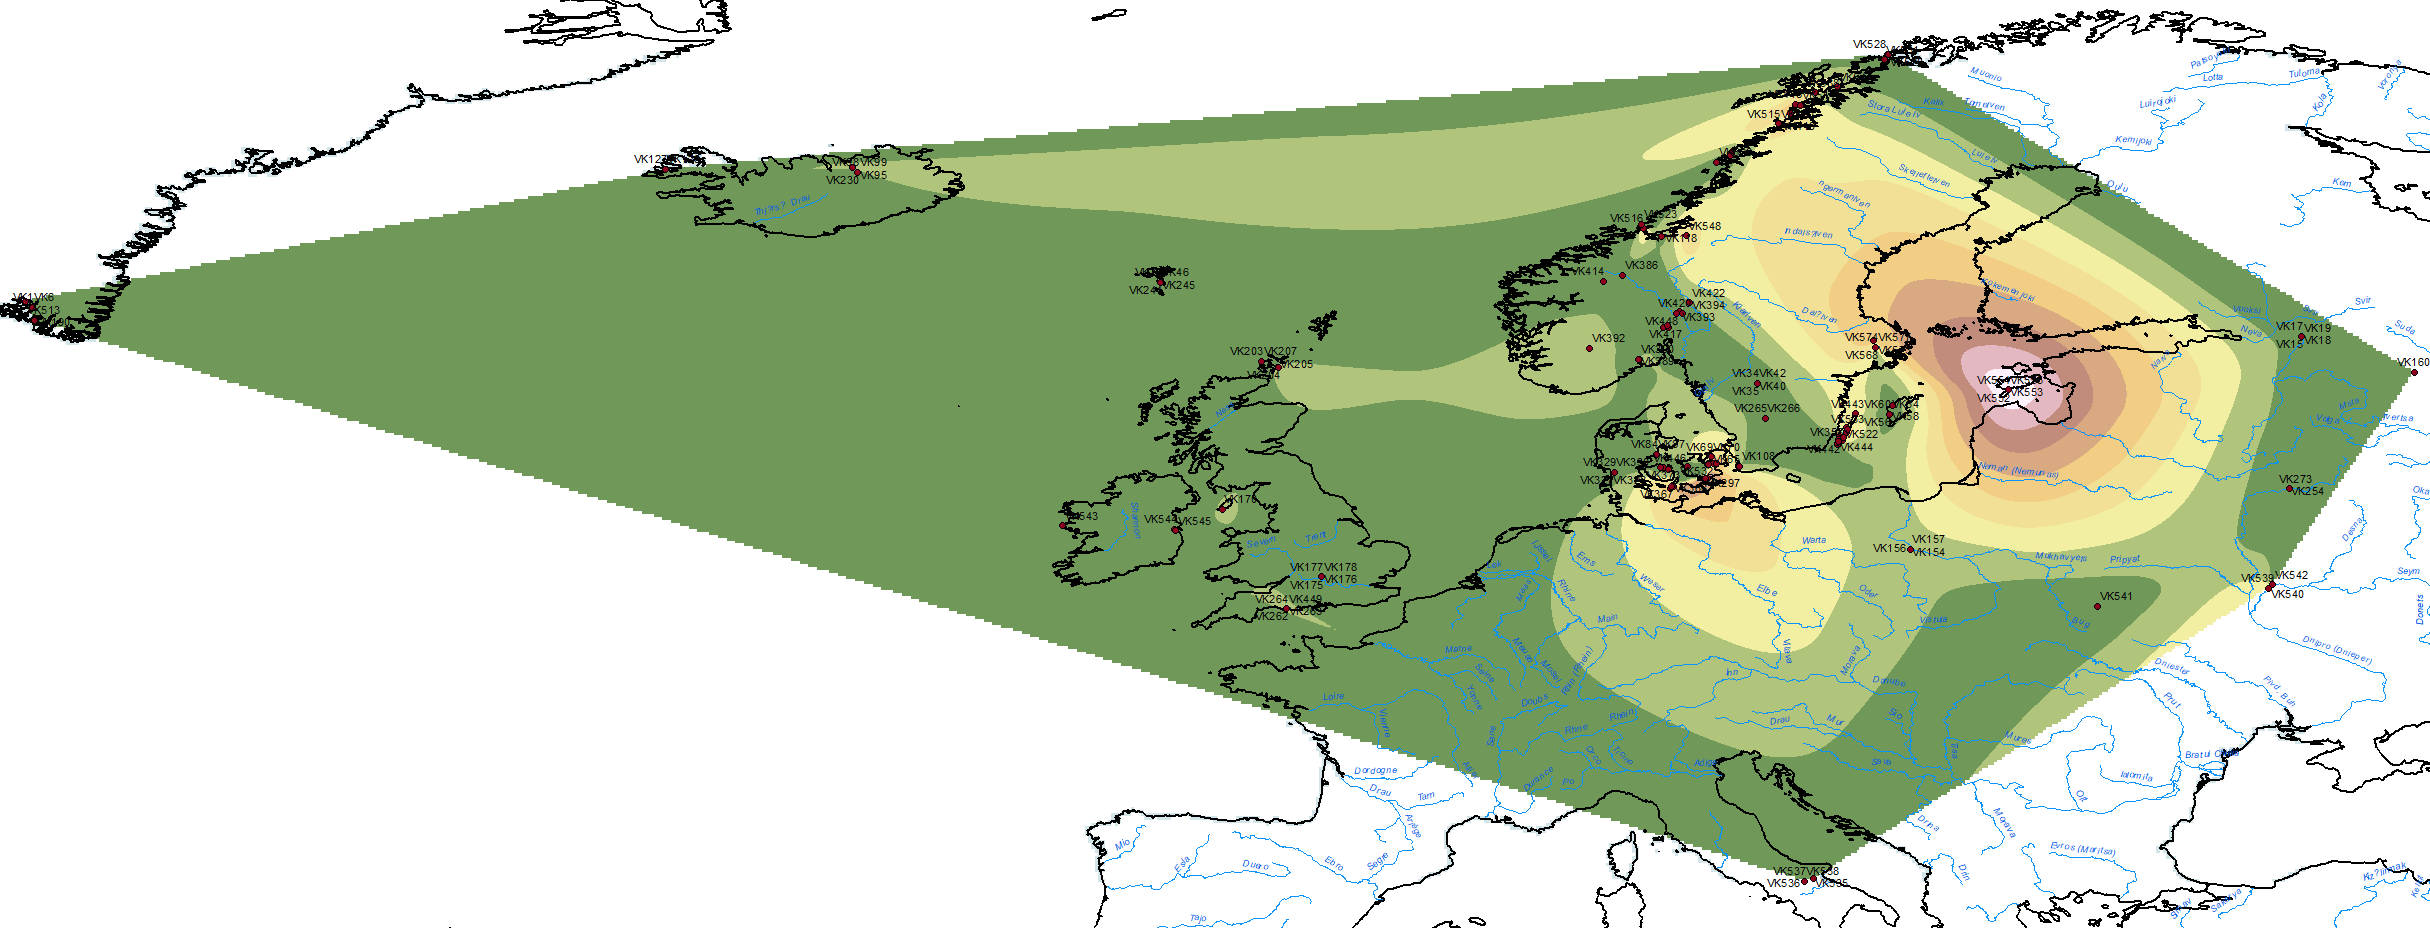
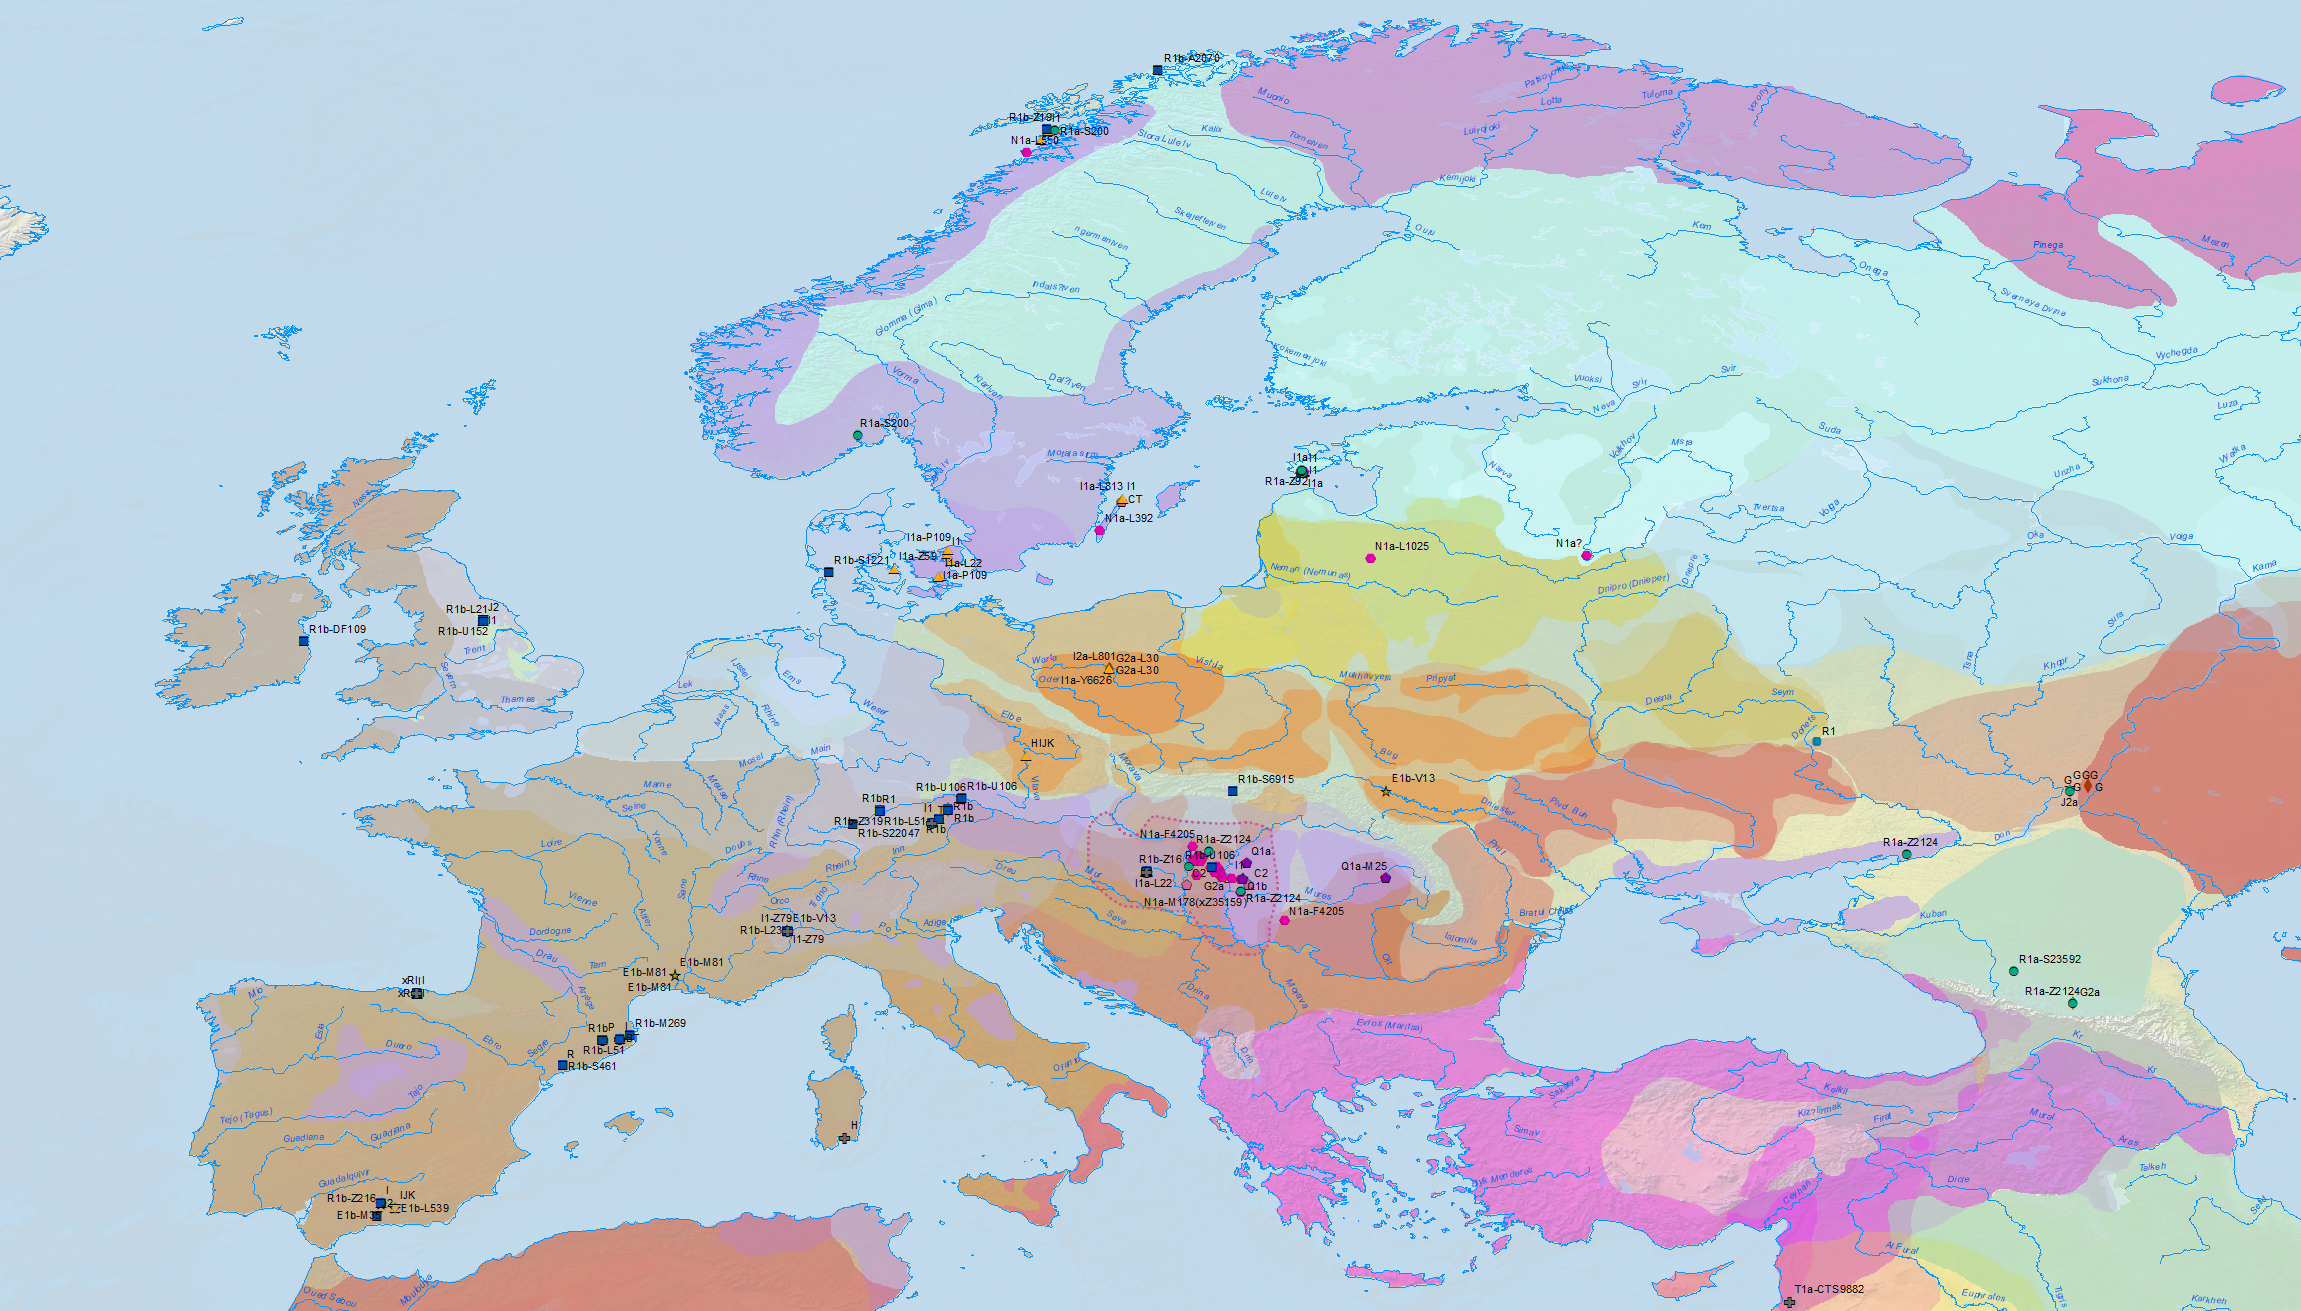
Density of haplogroup N1a-VL29, N1a-L550 (samples in pink, most not visible) among Vikings. Samples of hg. R1b in blue, hg. R1a in green, hg. I in orange.
Finnish ancestry
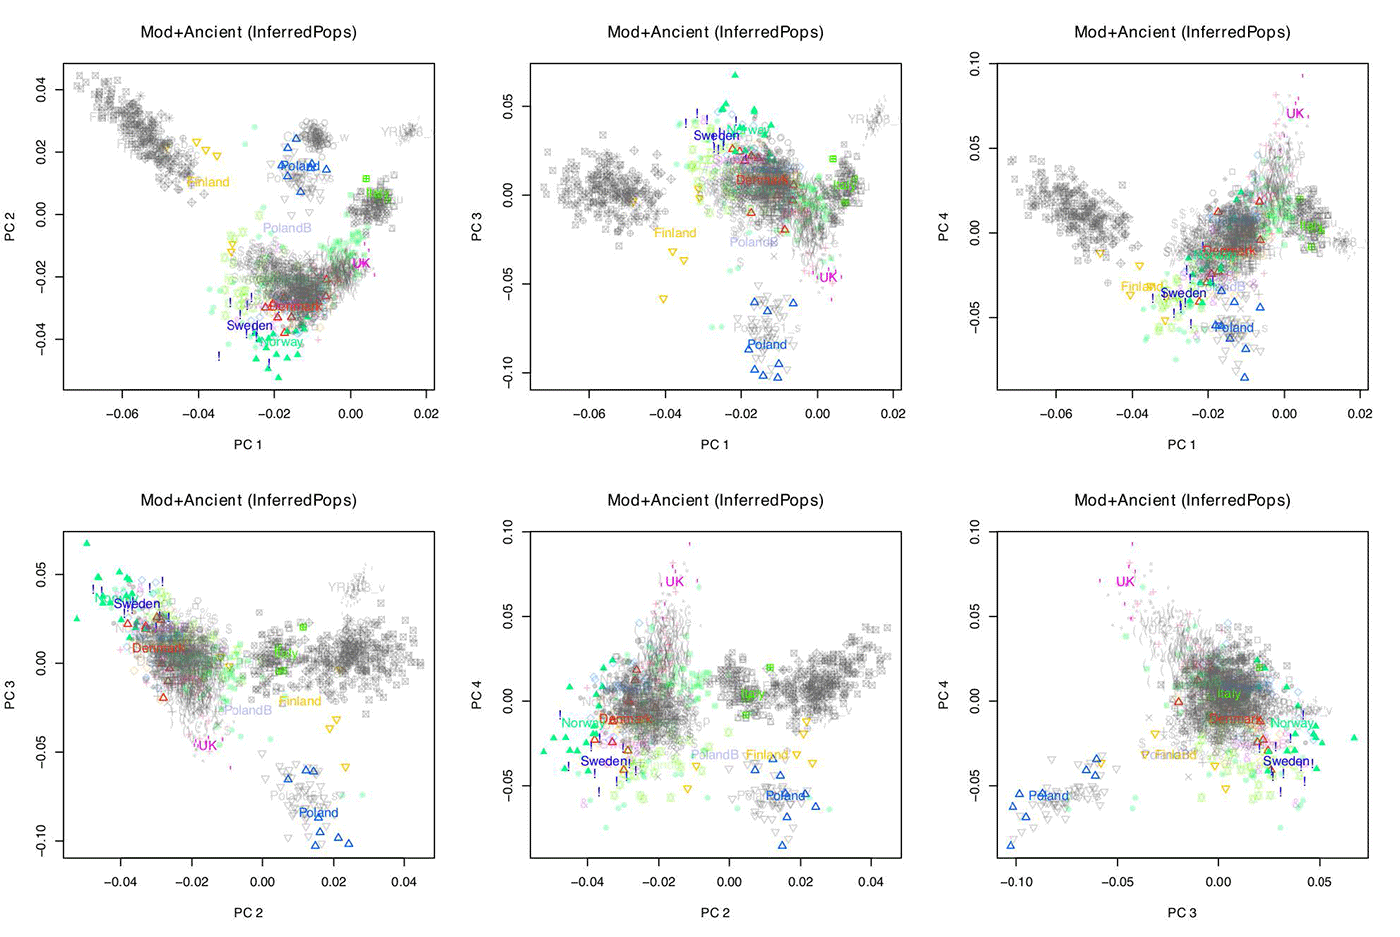
Firstly, modern Finnish individuals are not like ancient Finnish individuals, modern individuals have ancestry of a population not in the reference; most likely Steppe/Russian ancestry, as Chinese are in the reference and do not share this direction. Ancient Swedes and Norwegians are more extreme than modern individuals in PC2 and 4. Ancient UK individuals were more extreme than Modern UK individuals in PC3 and 4. Ancient Danish individuals look rather similar to modern individuals from all over Scandinavia. By using a supervised ancient panel, we have removed recent drift from the signal, which would have affected modern Scandinavians and Finnish populations especially. This is in general a desirable feature but it is important to check that it has not affected inference.
PCA of the ancient and modern samples using the ancient palette, showing different PCs. Modern individuals are grey and the K=7 ancient panel surrogate populations are shown in strong colors, whilst the remaining M-K=7 ancient populations are shown in faded colors.
The story for Modern-vs-ancient Finnish ancestry is consistent, with ancient Finns looking much less extreme than the moderns. Conversely, ancient Norwegians look like less-drifted modern Norwegians; the Danish admixture seen through the use of ancient DNA is hard to detect because of the extreme drift within Norway that has occurred since the admixture event. PC4 vs PC5 is the most important plot for the ancient DNA story: Sweden and the UK (along with Poland, Italy and to an extent also Norway) are visibly extremes of a distribution the same “genes-mirror-geography” that was seen in the Ancient-palette analysis. PC1 vs PC2 tells the same story – and stronger, since this is a high variance-explained PC – for the UK, Poland and Italy.
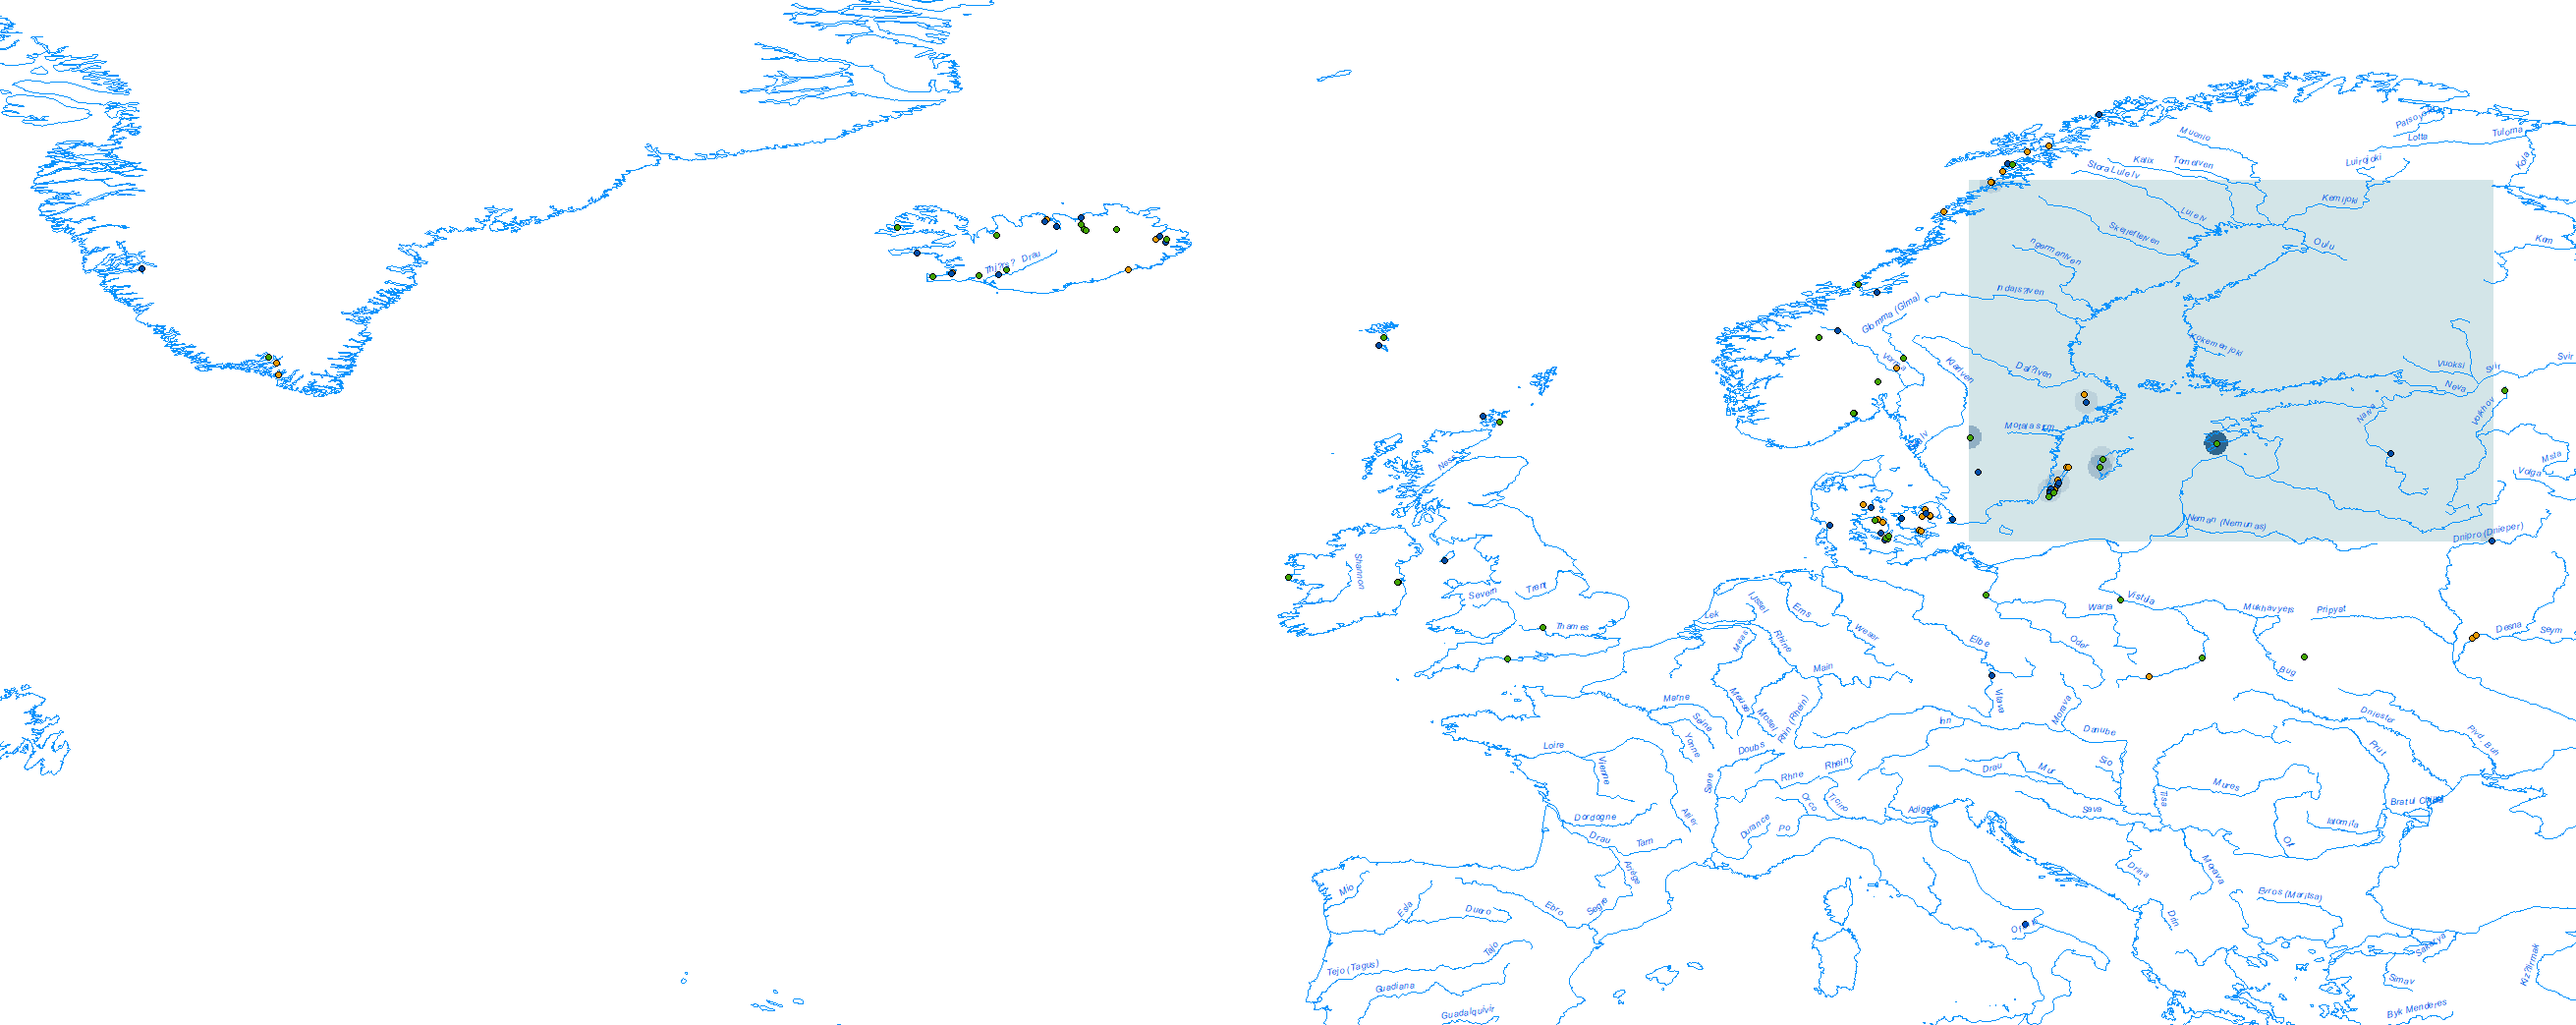
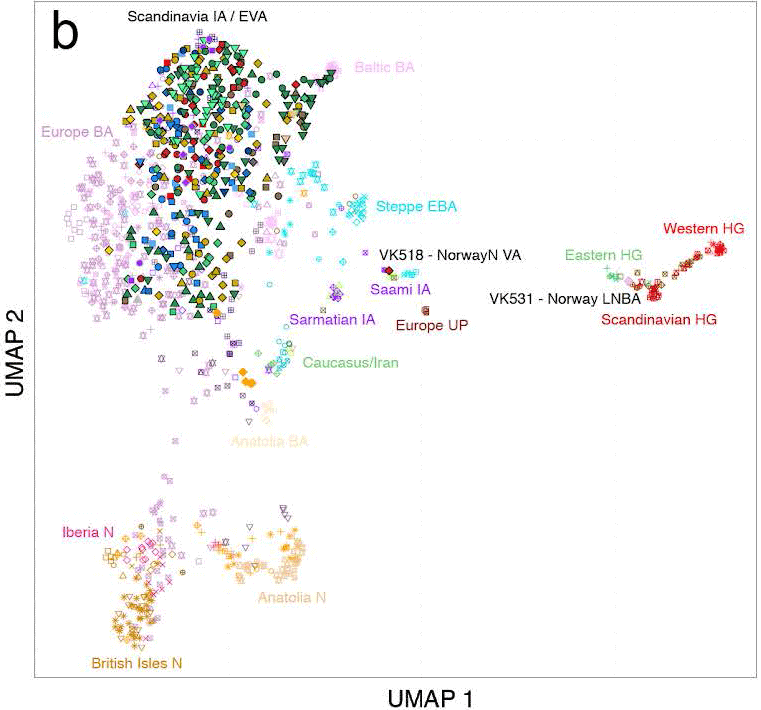
Uniform manifold approximation and projection (UMAP) analysis of the VA and other ancient samples.
Evidence for Pictish Genomes
The four ancient genomes of Orkney individuals with little Scandinavian ancestry may be the first ones of Pictish people published to date. Yet a similar (>80% “UK ancestry) individual was found in Ireland (VK545) and five in Scandinavia, implying that Pictish populations were integrated into Scandinavian culture by the Viking Age.
Our interpretation for the Orkney samples can be summarised as follows. Firstly, they represent “native British” ancestry, rather than an unusual type of Scandinavian ancestry. Secondly, that this “British” ancestry was found in Britain before the Anglo-Saxon migrations. Finally, that in Orkney, these individuals would have descended from Pictish populations.
Natural neighbor interpolation of “British ancestry” among Vikings.
(…) ‘UK’ represents a group from which modern British and Irish people all receive an ancestry component. This information together implies that within the sampling frame of our data, they are proxying the ‘Briton’ component in UK ancestry; that is, a pre-Roman genetic component present across the UK. Given they were found in Orkney, this makes it very likely that they were descended from a Pictish population.
Modern genetic variation within the UK sees variation between ‘native Briton’ populations Wales, Scotland, Cornwall and Ireland as large compared to that within the more ‘Anglo-Saxon’ English. This is despite subsequent gene flow into those populations from English-like populations. We have not attempted to disentangle modern genetic drift from historically distinct populations. Roman-era period people in England, Wales, Ireland and Scotland may not have been genetically close to these Orkney individuals, but our results show that they have a shared genetic component as they represent the same direction of variation.
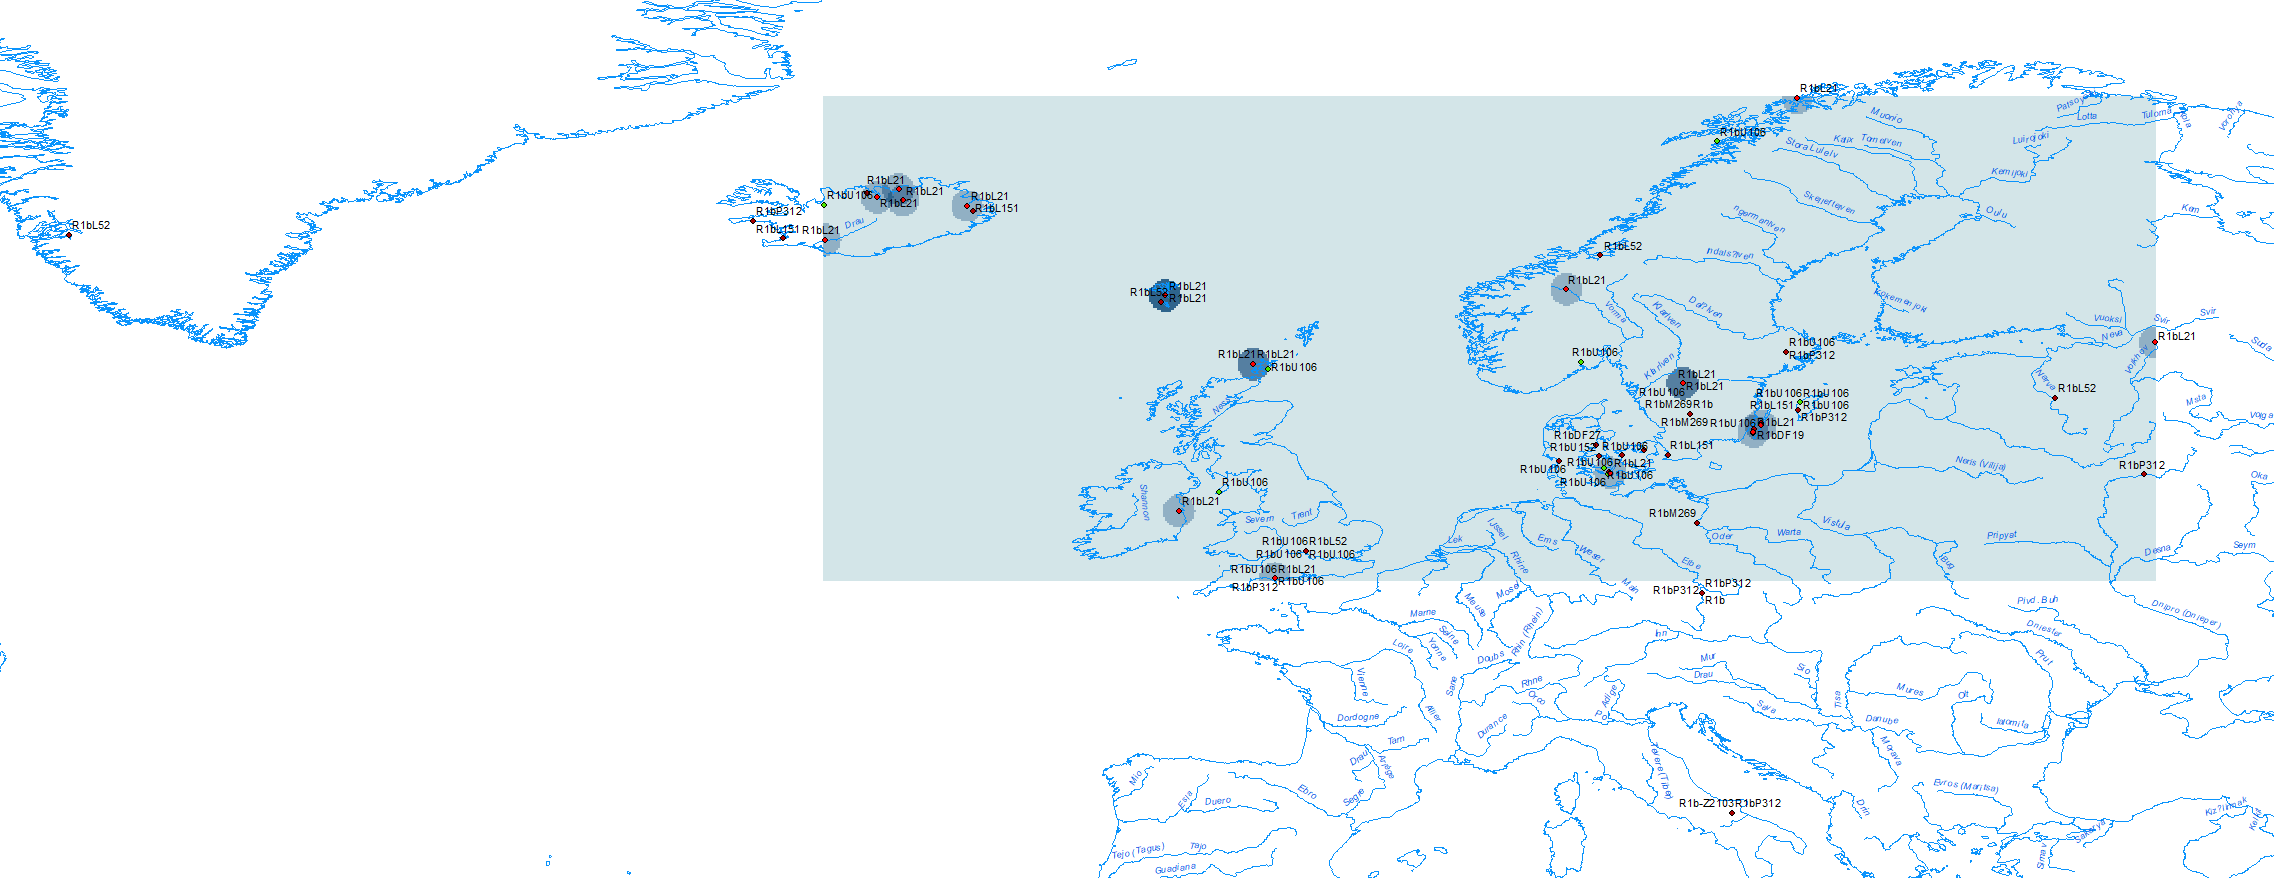
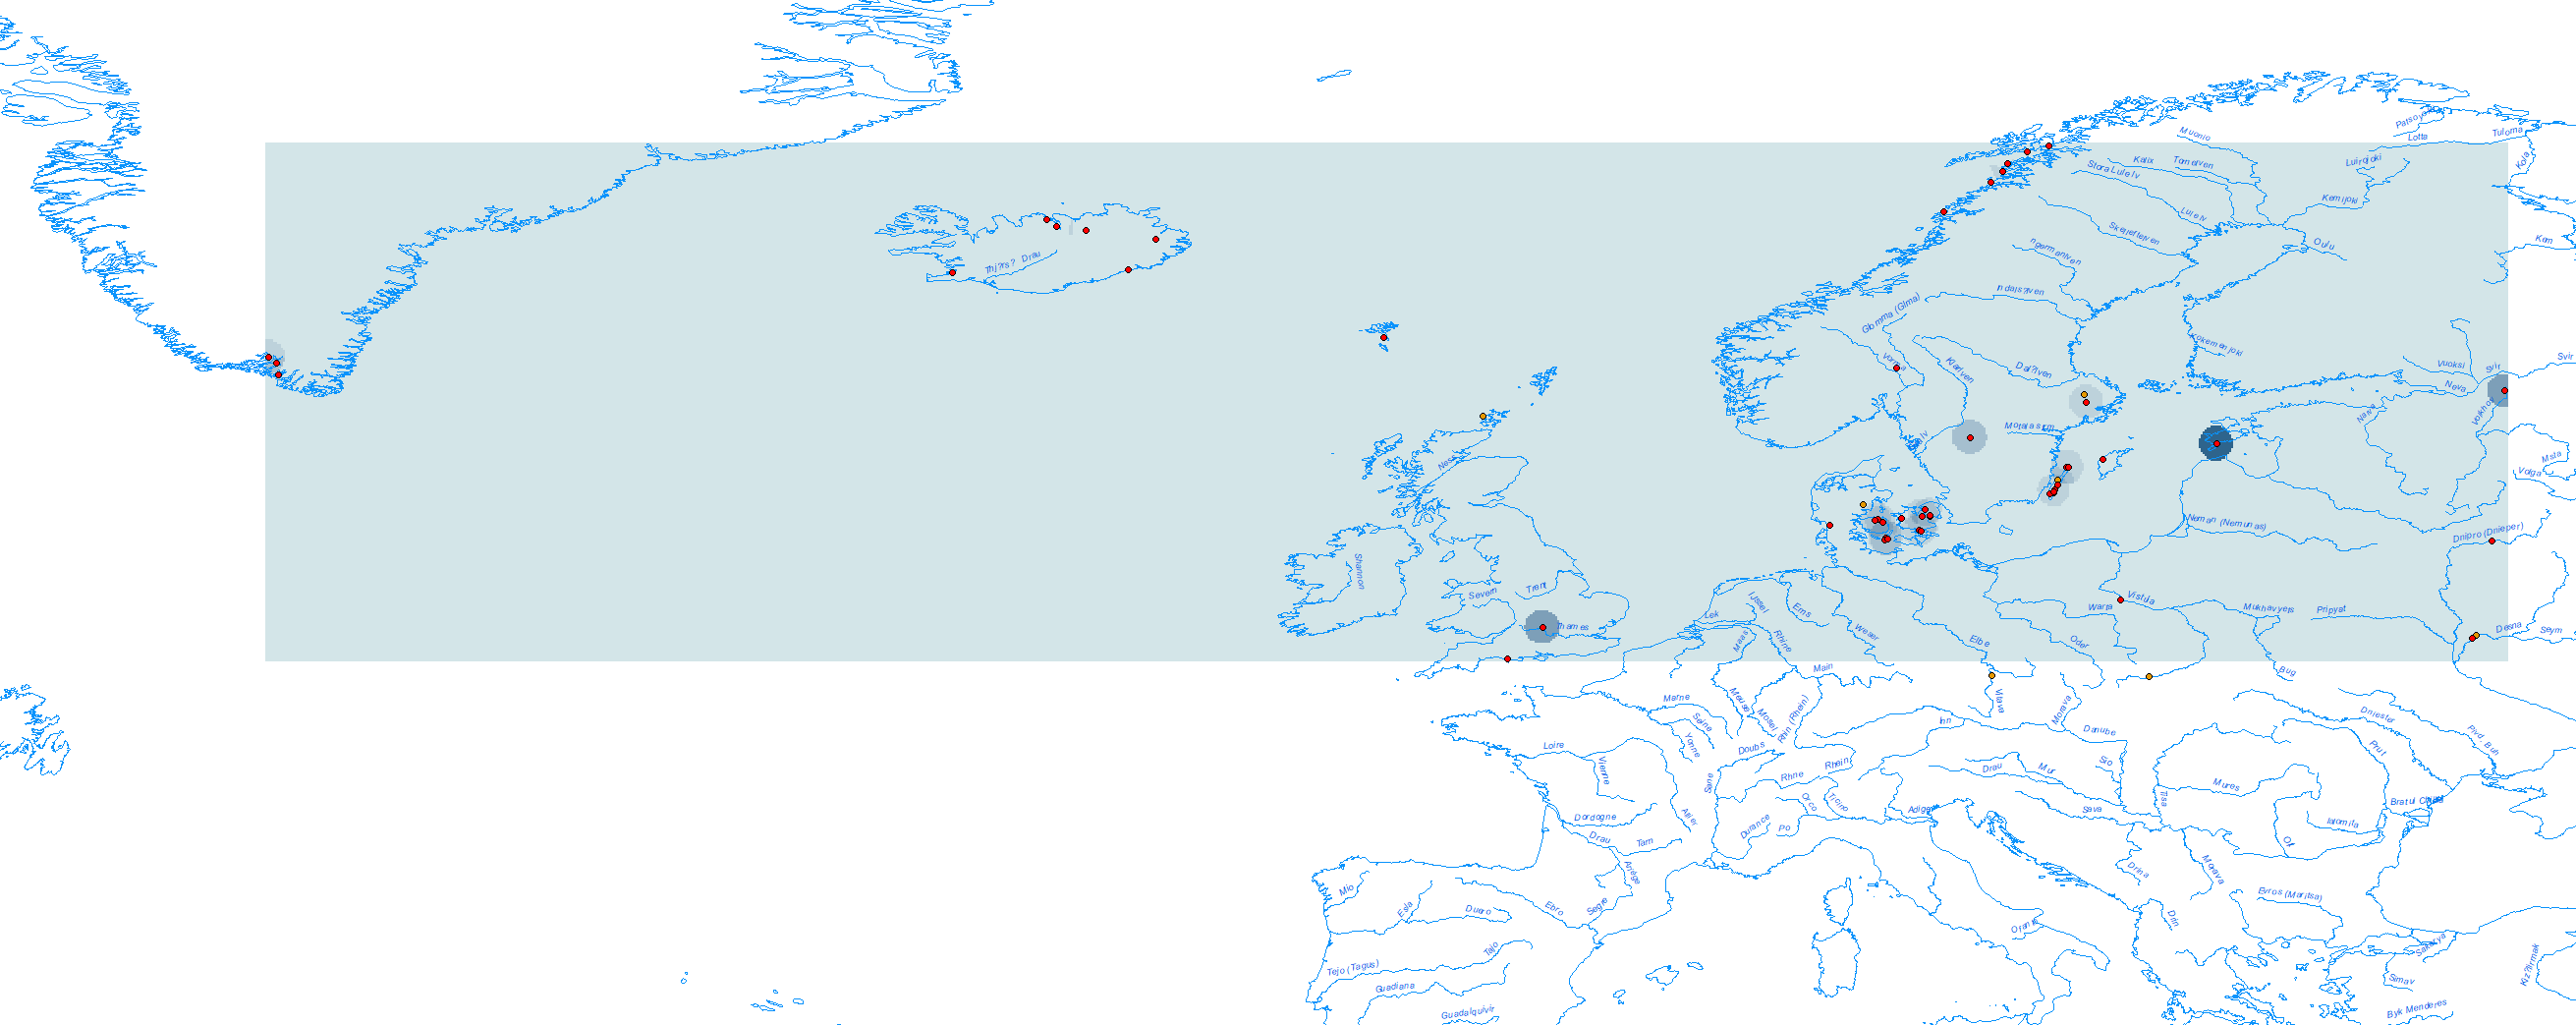
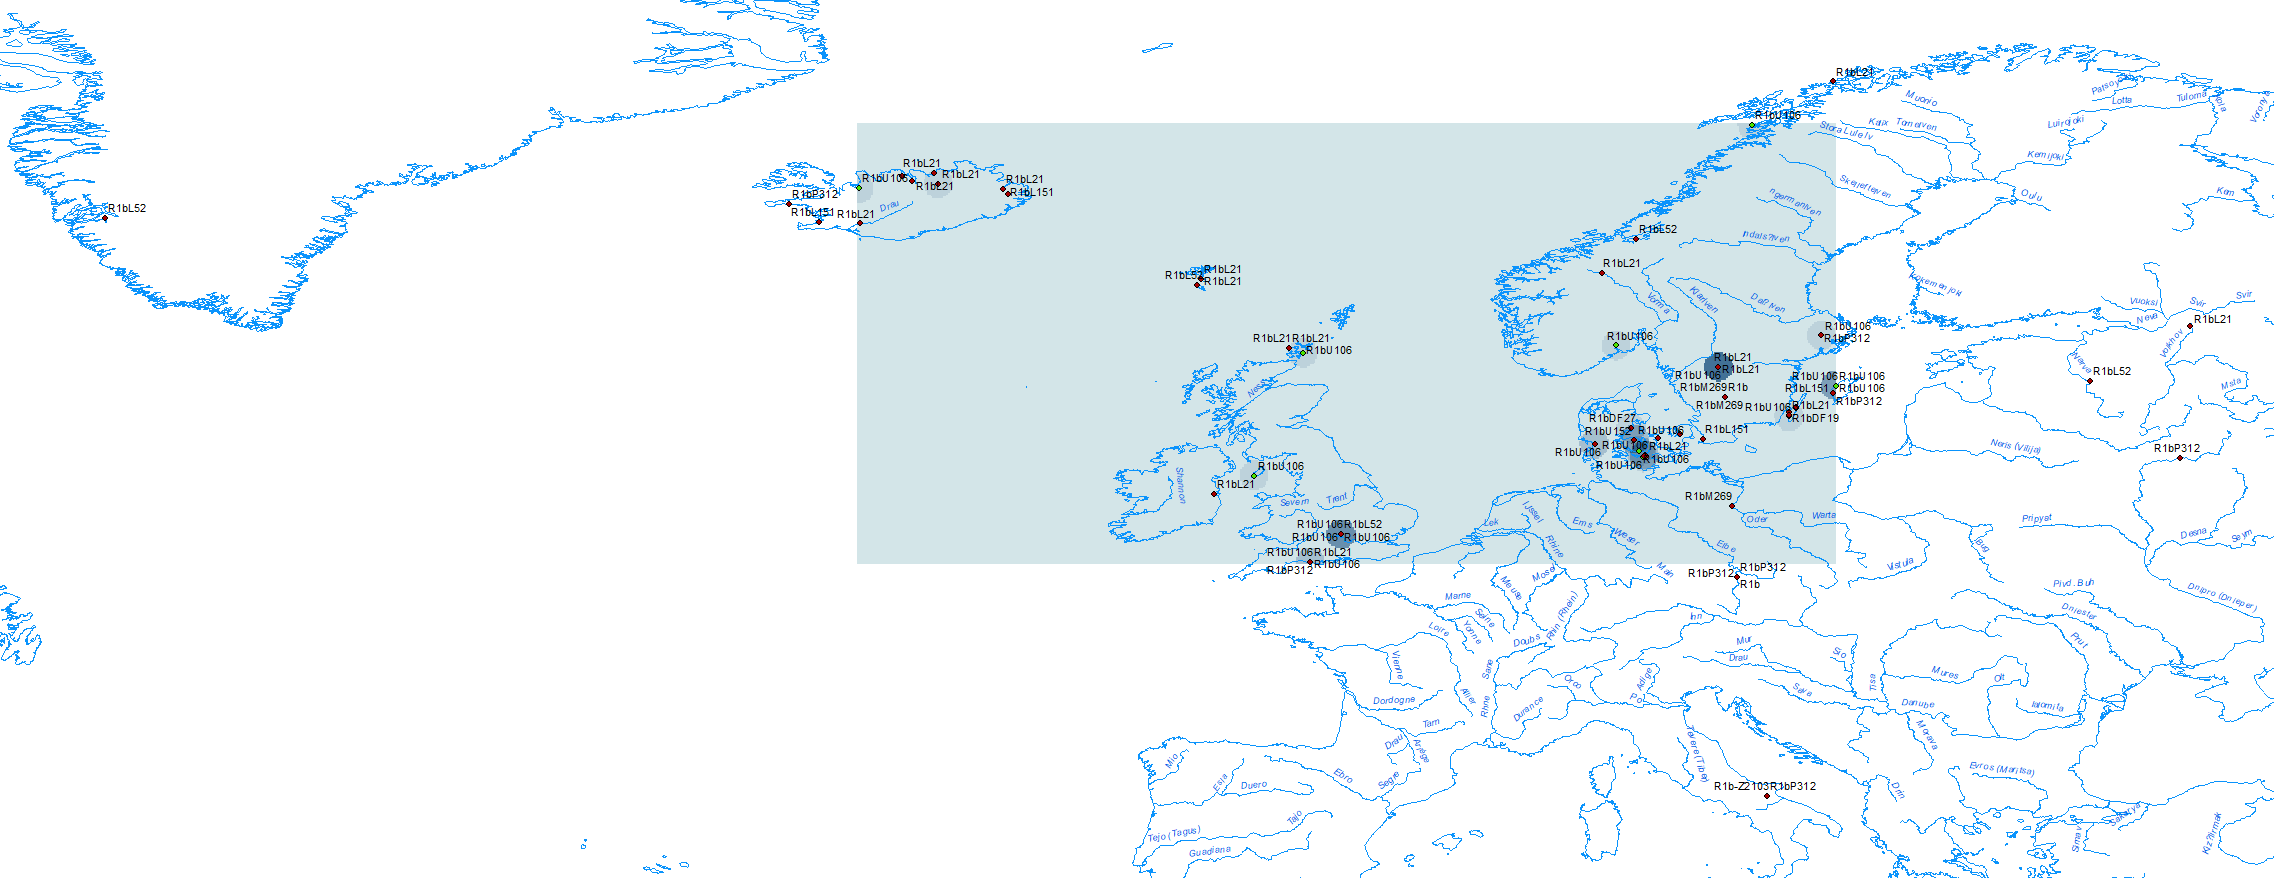
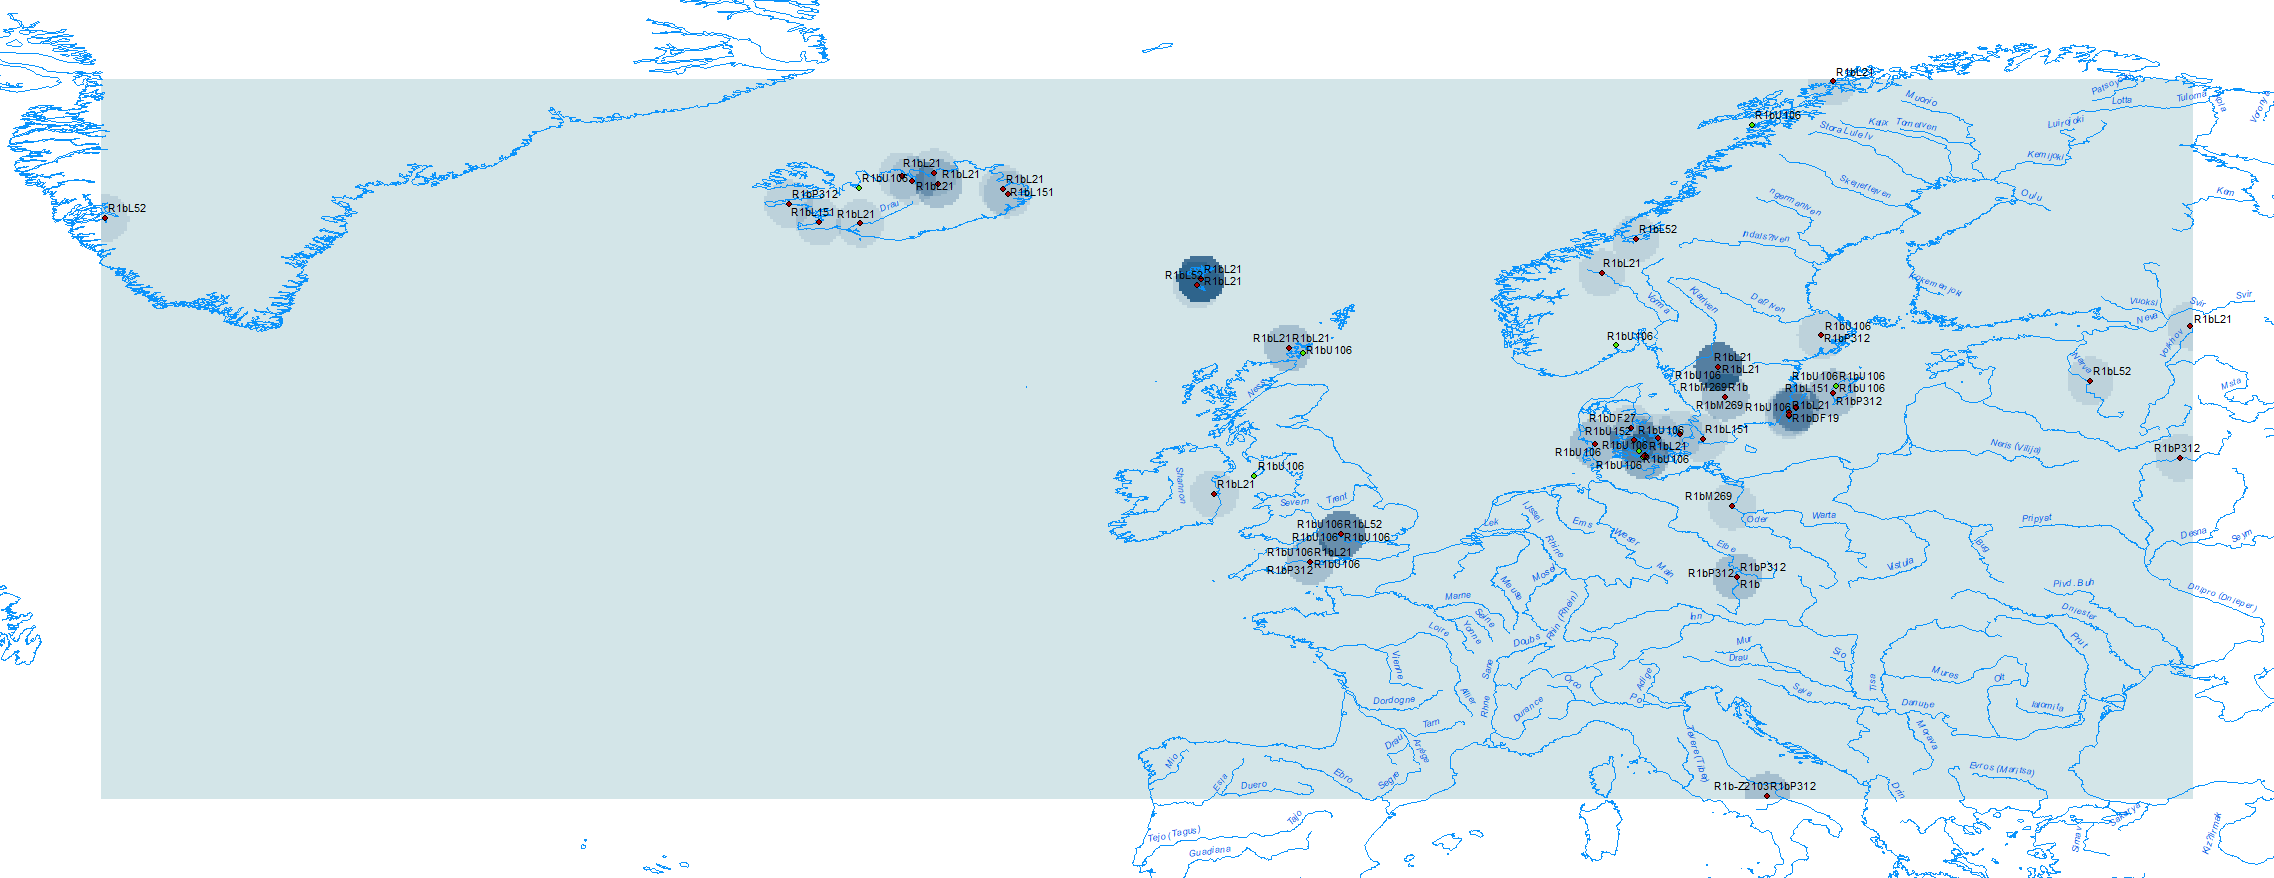
Density of haplogroup R1b-L21 (samples in red), overlaid over all samples of hg. R1b among Vikings (R1b-U106 in green, other R1b-L151 in deep red). To these samples one may add the one from Janakkala in south-western Finland (AD ca. 1300), of hg. R1b-L21, possibly related to these population movements.
For more on Gaelic ancestry and lineages likely representing slaves among early Icelanders, see Ebenesersdóttir et al. (2018).
Y-DNA
As in the case of mitochondrial DNA, the overall distribution profile of the Y chromosomal haplogroups in the Viking Age samples was similar to that of the modern North European populations. The most frequently encountered male lineages were the haplogroups I1, R1b and R1a.
Haplogroup I (I1, I2)
The distribution of I1 in southern Scandinavia, including a sample from Sealand (VK532) ca. AD 100 (see Iron Age Y-DNA maps) proves that it had become integrated into the West Germanic population already before their expansions, something that we already suspected thanks to the sampling of Germanic tribes.
Density of haplogroup I (samples in orange) among Vikings. Samples of hg. R1b in blue, hg. R1a in green, N1a in pink.Density of haplogroup I1 (samples in red) overlaid over all samples of hg. I among Vikings.
Haplogroup R1b (M269, U106, P312)
Especially interesting is the finding of R1b-L151 widely distributed in the historical Nordic Bronze Age region, which is in line with the estimated TMRCA for R1b-P312 subclades found in Scandinavia, despite the known bottleneck among Germanic peoples under U106. Particularly telling in this regard is the finding of rare haplogroups R1b-DF19, R1b-L238, or R1b-S1194. All of that points to the impact of Bell Beaker-derived peoples during the Dagger period, when Pre-Proto-Germanic expanded into Scandinavia.
Also interesting is the finding of hg. R1b-P297 in Troms, Norway (VK531) ca. 2400 BC. R1b-P297 subclades might have expanded to the north through Finland with post-Swiderian Mesolithic groups (read more about Scandinavian hunter-gatherers), and the ancestry of this sample points to that origin.
However, it is also known that ancestry might change within a few generations of admixture, and that the transformation brought about by Bell Beakers with the Dagger Period probably reached Troms, so this could also be a R1b-M269 subclade. In fact, the few available data from this sample show that it comes from the natural harbour Skarsvågen at the NW end of the island Senja, and that its archaeologist thought it was from the Viking period or slightly earlier, based on the grave form. From Prescott (2017):
In 1995, Prescott and Walderhaug tentatively argued that a dramatic transformation took place in Norway around the Late Neolithic (2350 BCE), and that the swift nature of this transition was tied to the initial Indo-Europeanization of southern and coastal Norway, at least to Trøndelag and perhaps as far north as Troms. (…)
The Bell Beaker/early Late Neolithic, however, represents a source and beginning of these institution and practices, exhibits continuity to the following metal age periods and integrated most of Northern Europe’s Nordic region into a set of interaction fields. This happened around 2400 BCE, at the MNB to LN transition.
#EDIT (16 SEPT 2020): Analysis with YLeaf v. 2.3 shows that the sample is, in fact, R1b-P297 (xM73,xM269), in accordance with its reported ancestry, so most likely related to a Mesolithic or later expansion into Scandinavia from north-eastern Europe, where many basal R1b-P297 have also been found.
NOTE. This particular sample is not included in the maps of Viking haplogroups.
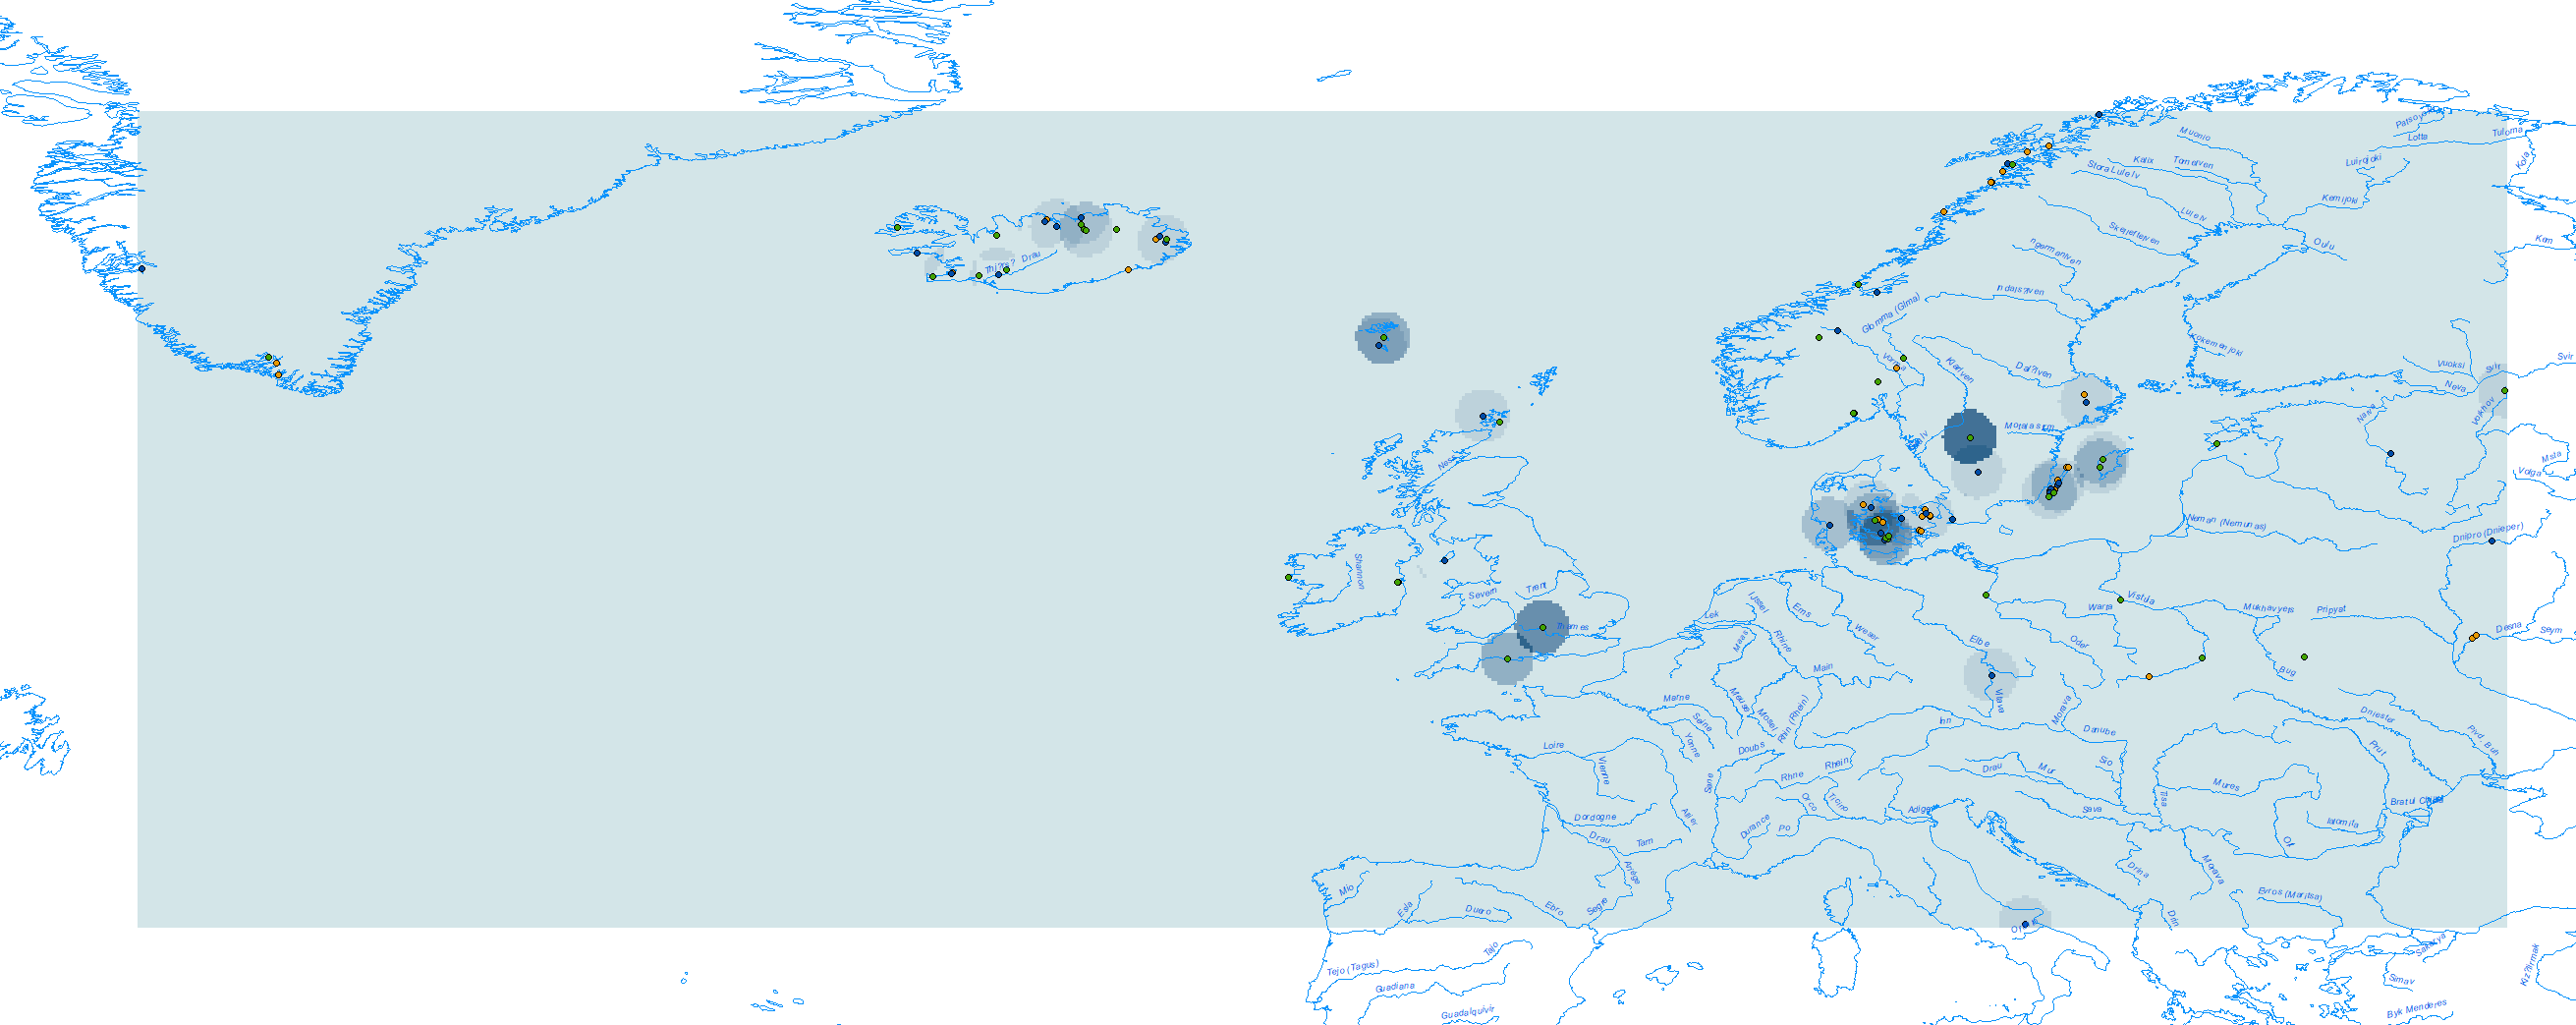
Density of haplogroup R1b (samples in blue) among Vikings. Samples of hg. I in orange, hg. R1a in green, N1a in pink.Density of haplogroup R1b-U106 (samples in green) overlaid over all samples of hg. R1b (other R1b-L23 samples in red) among Vikings.Density of R1b-L151 (xR1b-U106) (samples in deep red) overlaid over all samples of hg. R1b (R1b-U106 in green, other R1b-M269 in blue) among Vikings.
Haplogroup R1a (M417, Z284)
The distribution of hg. R1a-M417, in combination with data on West Germanic peoples, shows that it was mostly limited to Scandinavia, similar to the distribution of I1. In fact, taking into account the distribution of R1a-Z284 in particular, it seems even more isolated, which is compatible with the limited impact of Corded Ware in Denmark or the Northern European Plain, and the likely origin of R1a-Z284 in the expansion with Battle Axe from the Gulf of Finland. The distribution of R1a-Z280 (see map above) is particularly telling, with a distribution around the Baltic Sea mostly coincident with that of N1a.
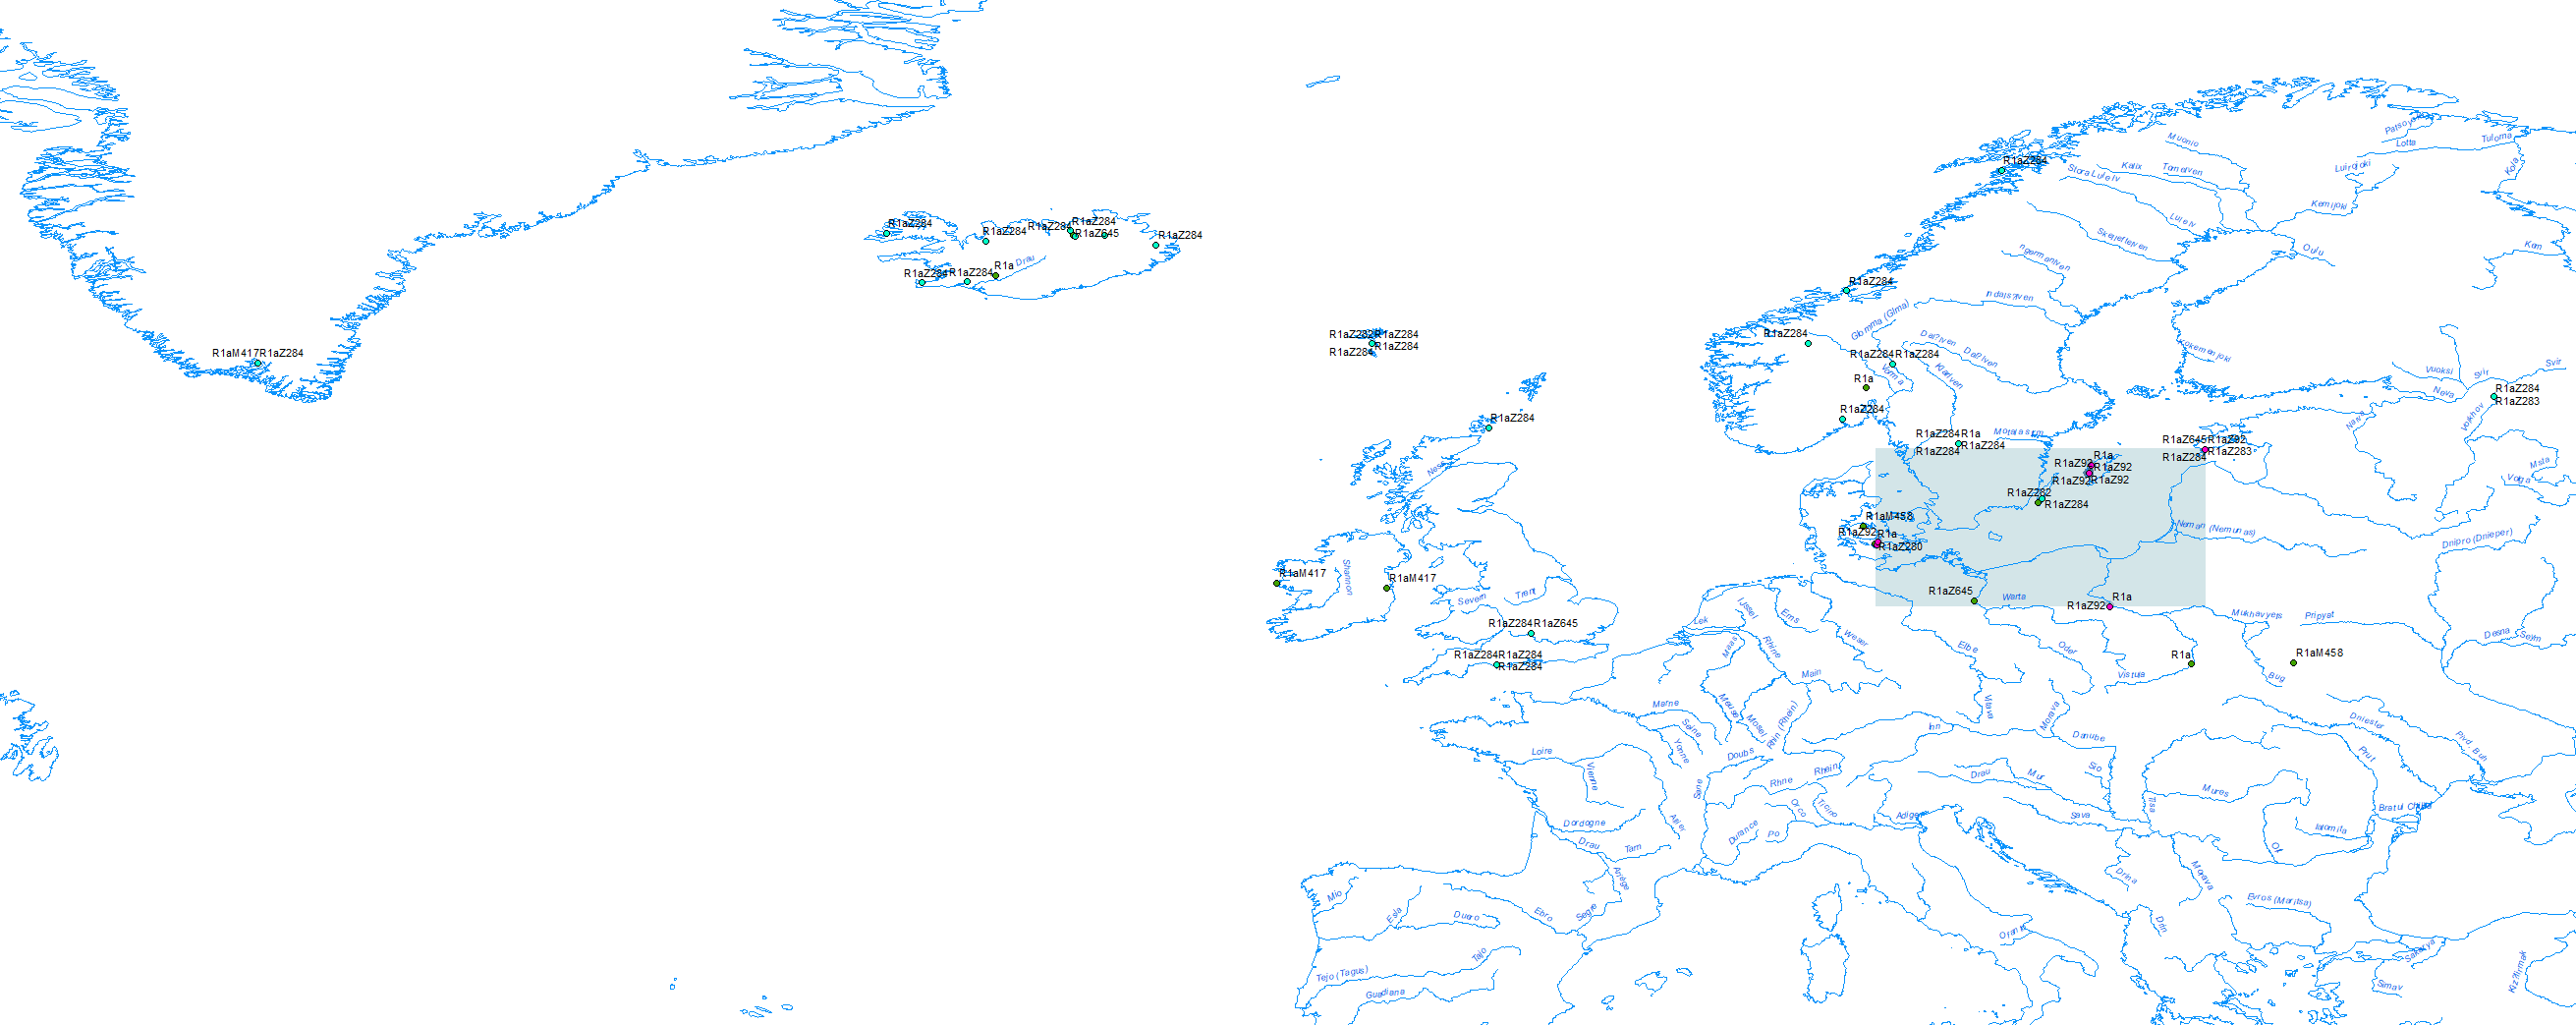
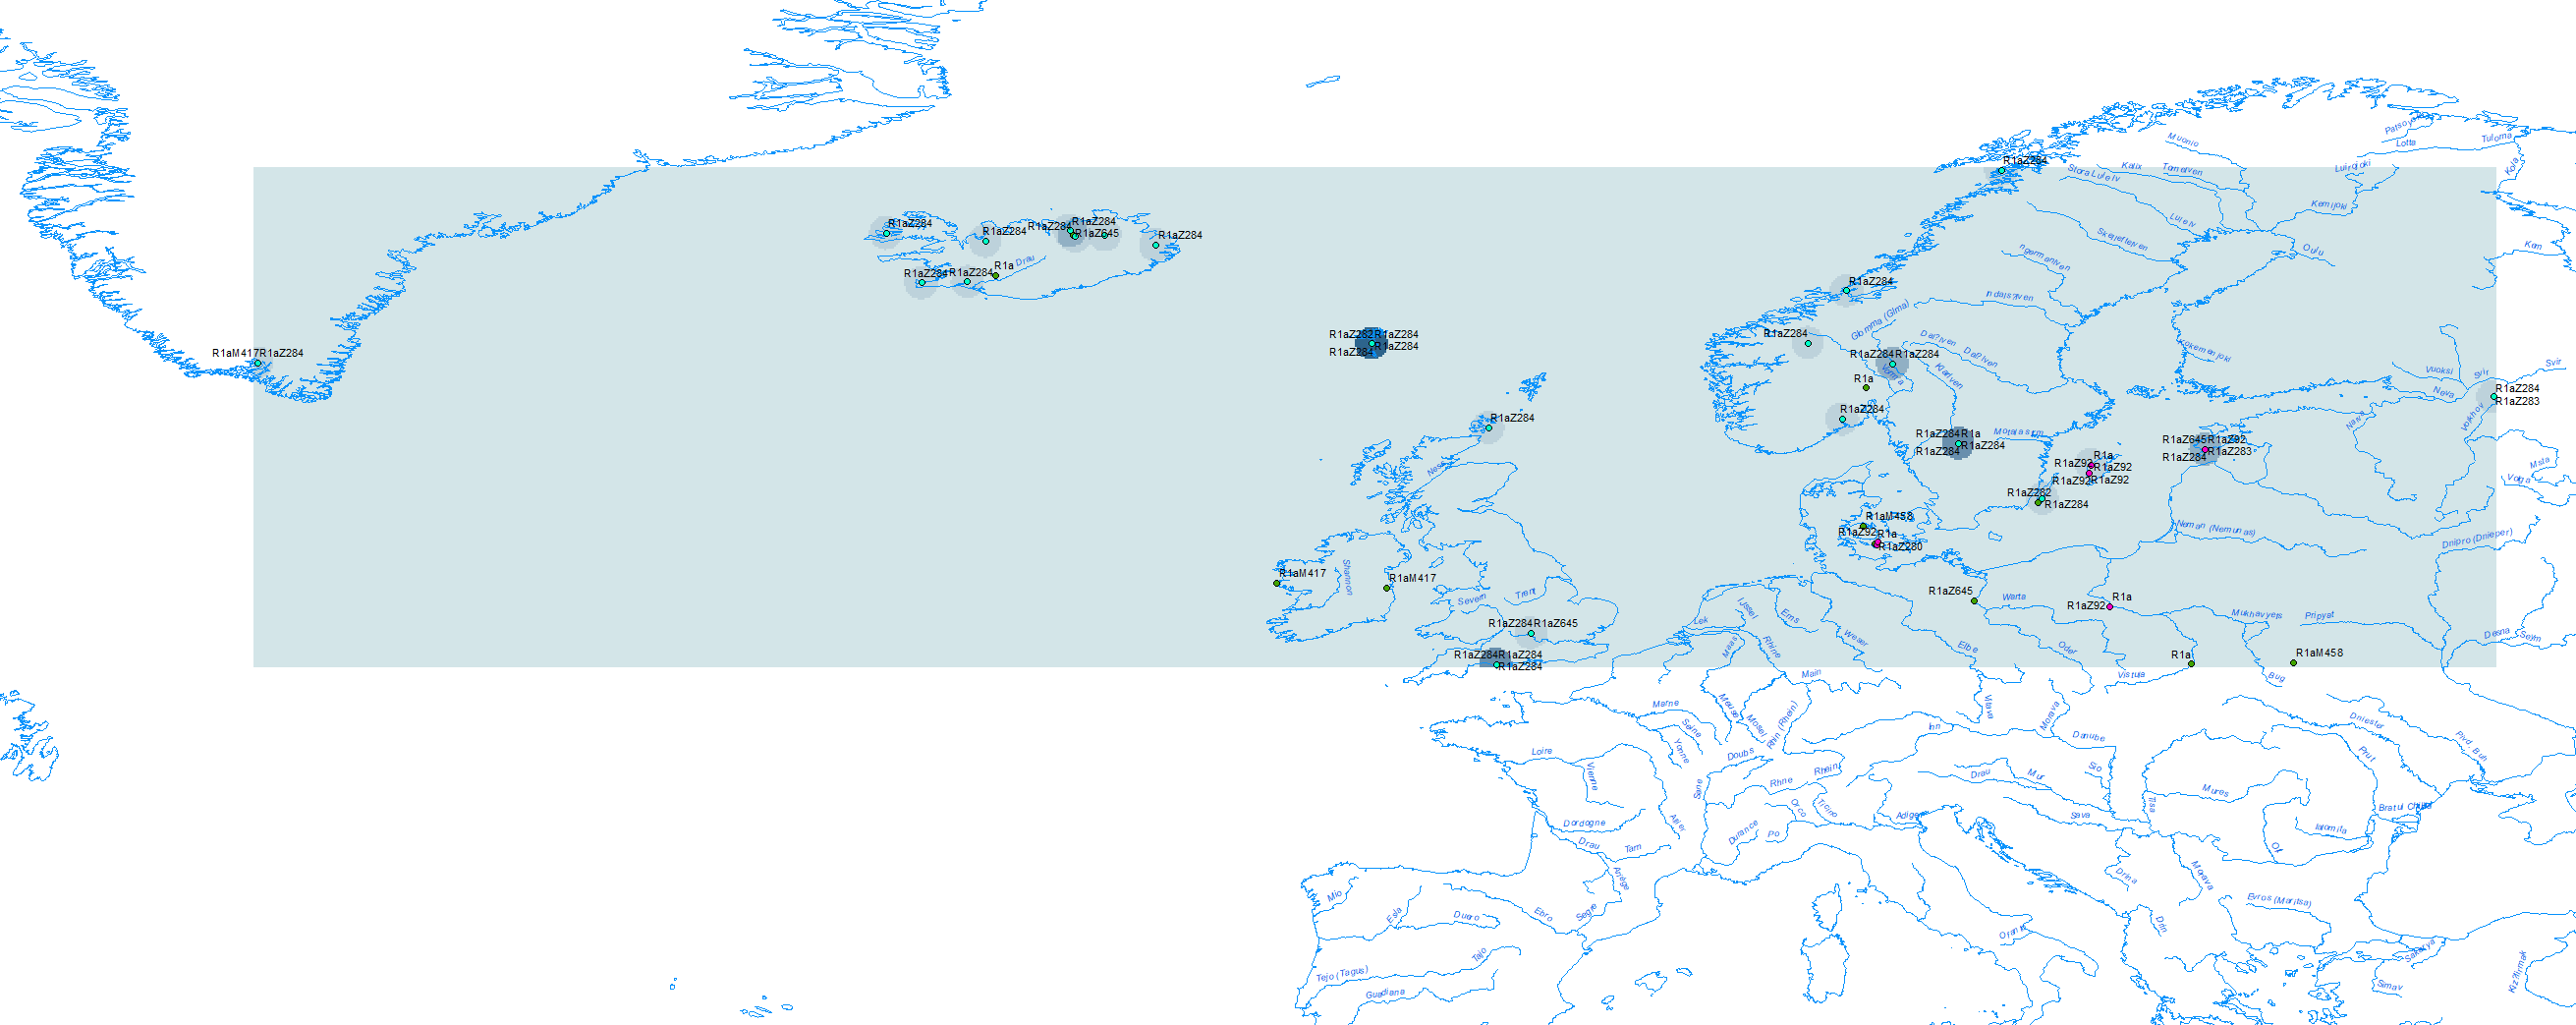
Density of haplogroup R1a (samples in green) among Vikings. Samples of hg. R1b in blue, of hg. I in orange, N1a in pink.Density of haplogroup R1a-Z284 (samples in cyan) overlaid over all samples of hg. R1a (in green, with R1a-Z280 in pink) among Vikings.
Other haplogroups
Among the ancient samples, two individuals were derived haplogroups were identified as E1b1b1-M35.1, which are frequently encountered in modern southern Europe, Middle East and North Africa. Interestingly, the individuals carrying these haplogroups had much less Scandinavian ancestry compared to the most samples inferred from haplotype based analysis. A similar pattern was also observed for less frequent haplogroups in our ancient dataset, such as G (n=3), J (n=3) and T (n=2), indicating a possible non-Scandinavian male genetic component in the Viking Age Northern Europe. Interestingly, individuals carrying these haplogroups were from the later Viking Age (10th century and younger), which might indicate some male gene influx into the Viking population during the Viking period.
Natural neighbor interpolation of “Italian ancestry” among Vikings.
As the paper says, the small sample size of rare haplogroups cannot distinguish if these differences are statistically relevant. Nevertheless, both E1b samples have substantial Modern Polish-like ancestry: one sample from Gotland (VK474), of hg. E1b-L791, has ca. 99% “Polish” ancestry, while the other one from Denmark (VK362), of hg. E1b-V13, has ca. 35% “Polish”, ca. 35% “Italian”, as well as some “Danish” (14%) and minor “British” and “Finnish” ancestry.
Given the E1b-V13 samples of likely Central-East European origin among Lombards, Visigoths, and especially among Early Slavs, and the distribution of “Polish” ancestry among Viking samples, VK362 is probably a close description of the typical ancestry of early Slavs. The peak of Modern Polish-like ancestry around the Upper Pripyat during the (late) Viking Age suggests that Poles (like East Slavs) have probably mixed since the 10th century with more eastern peoples close to north-eastern Europeans, derived from ancient Finno-Ugrians:
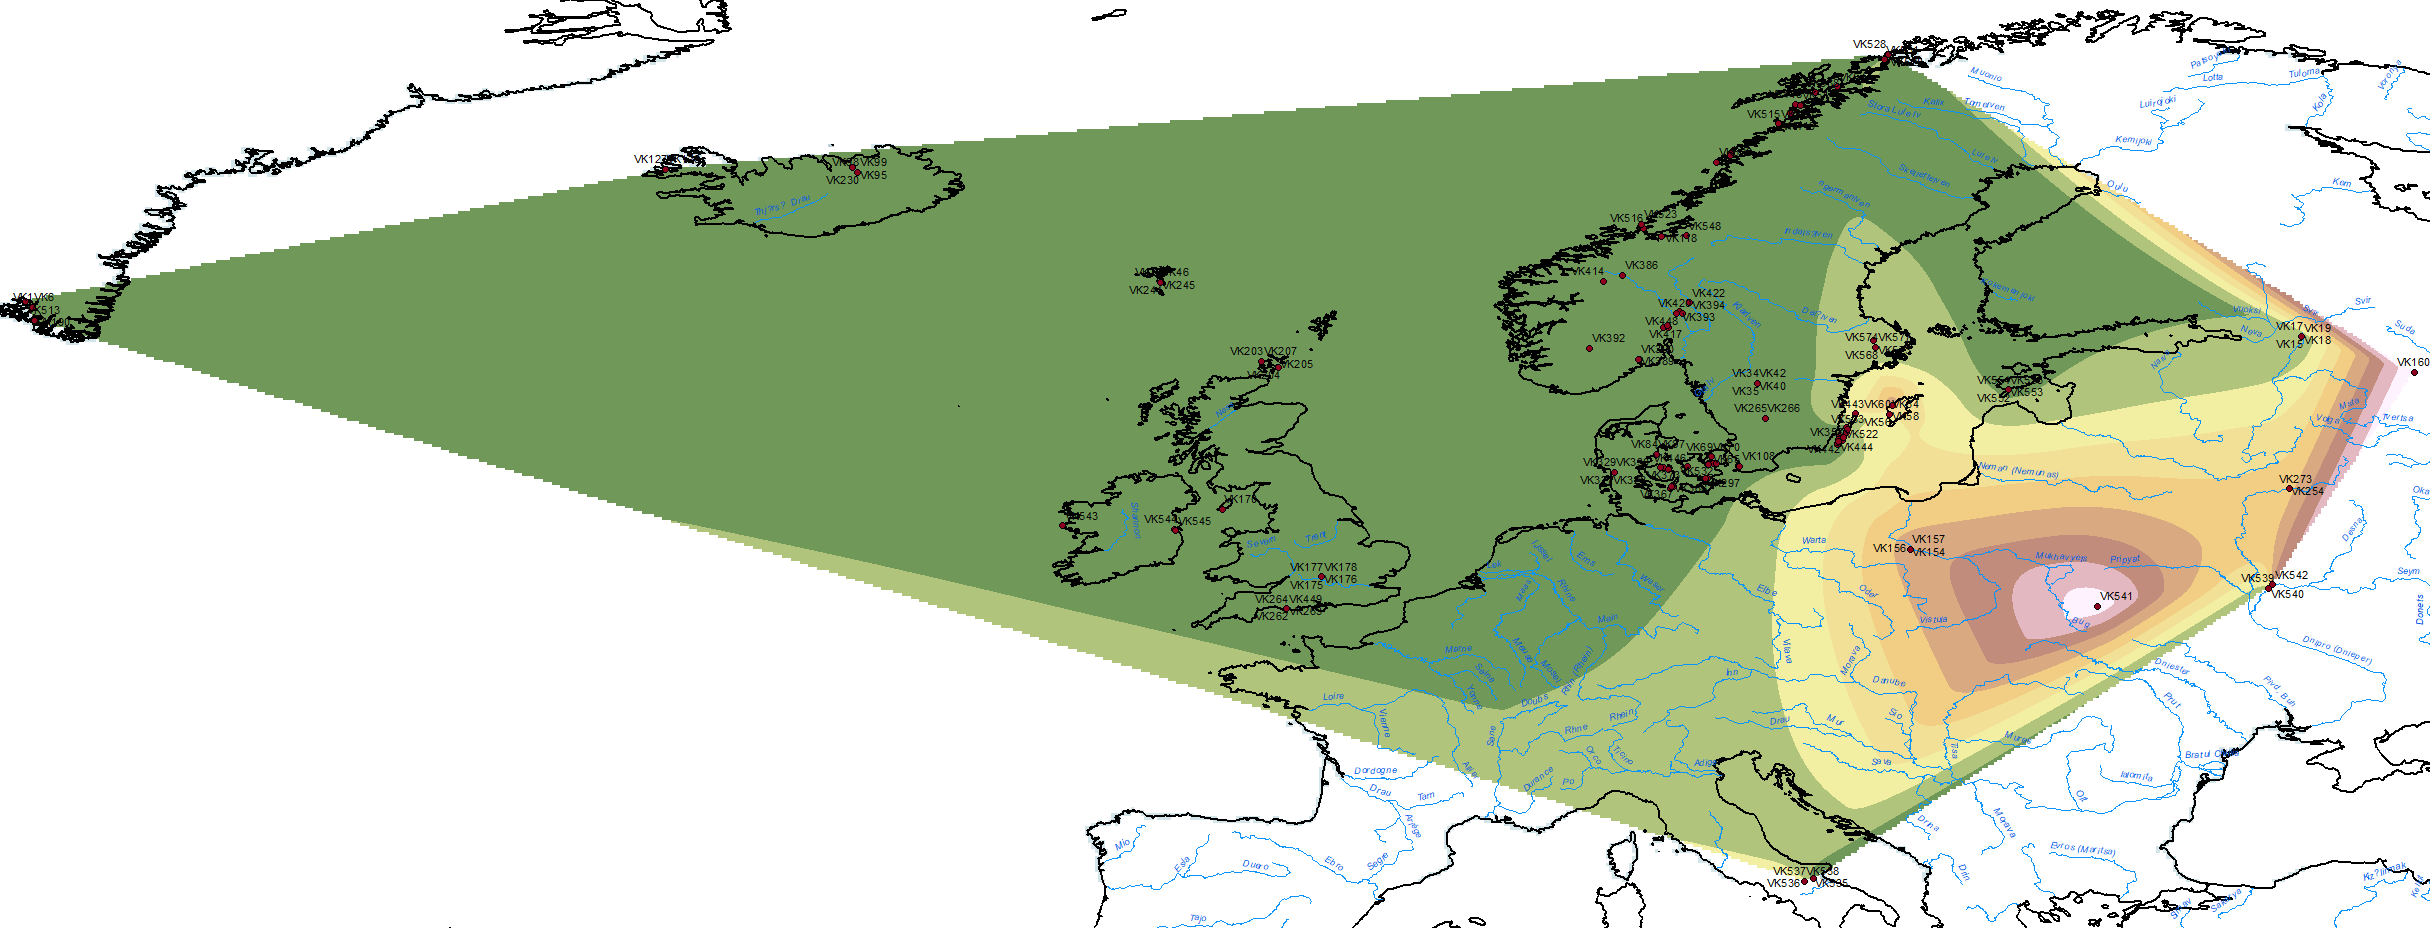
Natural neighbor interpolation of “Polish ancestry” among Vikings.
Similarly, the finding of R1a-M458 among Vikings in Funen, Denmark (VK139), in Lutsk, Poland (VK541), and in Kurevanikha, Russia (VK160), apart from the early Slav from Usedom, may attest to the origin of the spread of this haplogroup in the western Baltic after the Bell Beaker expansion, once integrated in both Germanic and Balto-Slavic populations, as well as intermediate Bronze Age peoples that were eventually absorbed by their expansions. This contradicts, again, my simplistic initial assessment of R1a-M458 expansion as linked exclusively (or even mainly) to Balto-Slavs.
It is good practice to be registered
and logged in to comment.
Please keep the discussion of this post on topic. Civilized discussion. Academic tone.
For other topics, use the forums instead.