New paper behind paywall Whole-genome sequencing of 175 Mongolians uncovers population-specific genetic architecture and gene flow throughout North and East Asia, by Bai et al Nature Genetics (2018).
Interesting excerpts (emphasis mine):
Genome sequencing, variant calling, and construction of the Mongolian reference panel. We collected peripheral blood with informed consent from 175 Mongolian individuals representing six distinct tribes/regions in northern China and Mongolia, including the Abaga, Khalkha, Oirat, Buryat, Sonid, and Horchin tribes.
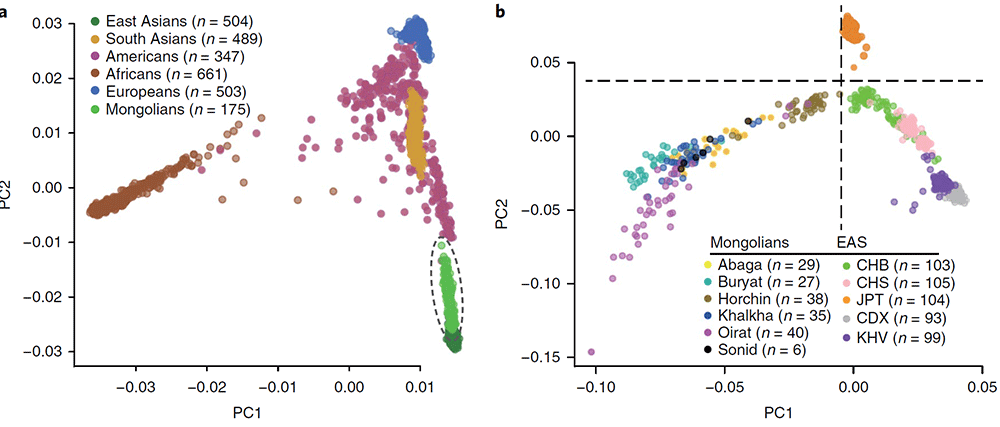
The fixation index (FST) was used to estimate pairwise genetic differentiation among our Mongolian samples and 26 modern human populations selected from 1000G (…) the Mongolian tribes cluster with East Asian groups. The Mongolian populations show the smallest differentiation from the CHB, and FST values increase relative to the magnitude of geographical separation. The Buryat are the most differentiated tribe compared with other East Asians (1.82–2.97%), while the Horchin are the least (0.25–1.35%). All tribes are closer to the Japanese (JPT) than the CHS with the exception of the Horchin. Among the tribes, the Abaga, Khalkha, Oirat, and Sonid show the least differentiation from one another (FST < 0.15%)
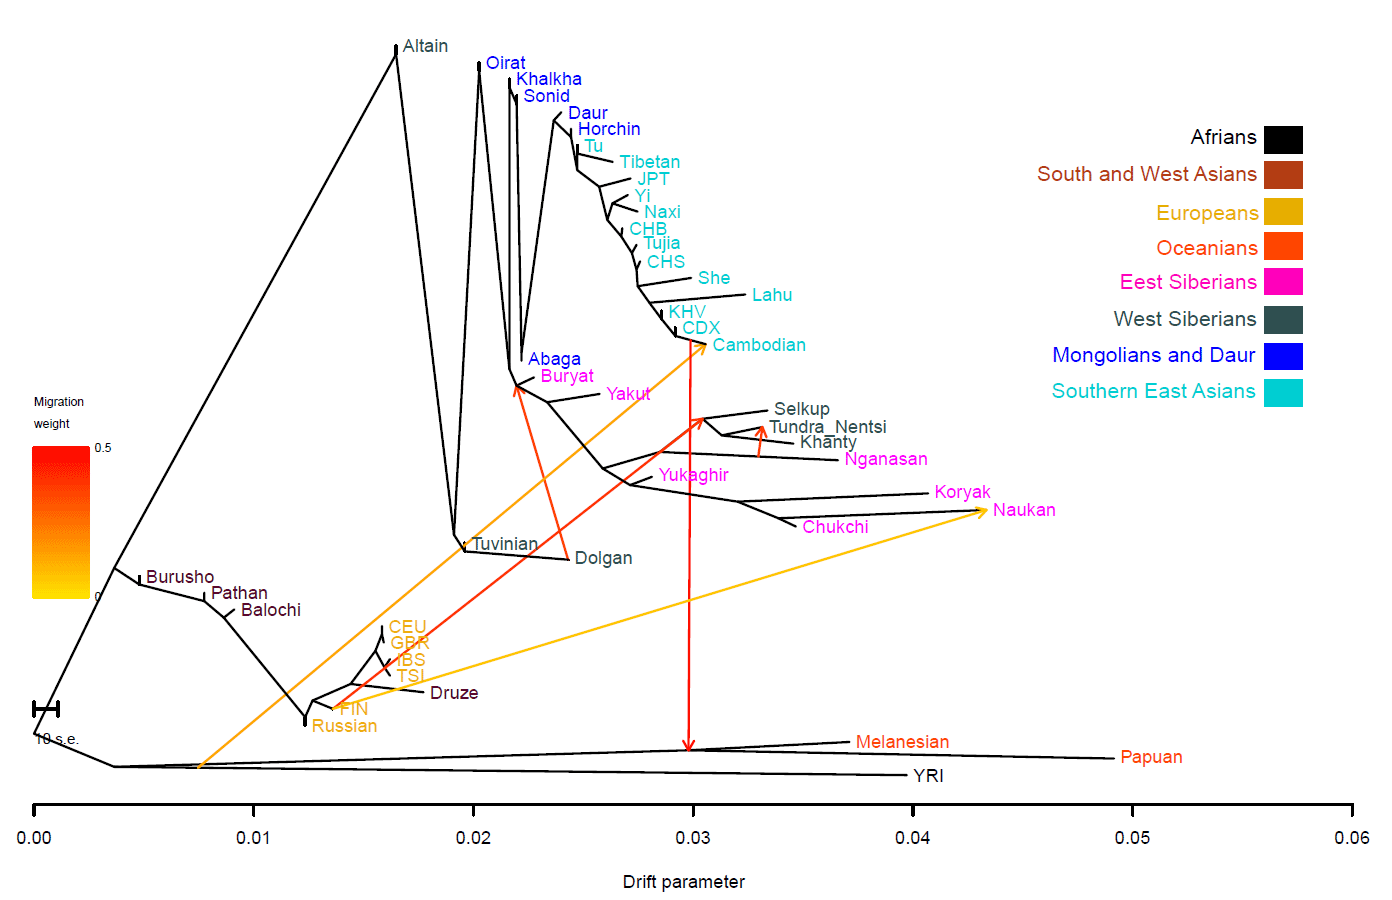
A PCA places the Mongolians in close genetic proximity to a group of North Asian Siberians, including Altaians, Tuvinians, Evenki, and Yakut, indicating that the Mongolian whole-genome variation panel could be a better proxy for these groups than any populations currently in the 1000G panel
The most common Y-chromosome haplogroups are from the C3 sublineage (41.67%), including C3c (29.17%) and C3b (12.50%), followed by haplogroup O (23.61%), and haplogroup N (18.06%) (…) While haplogroups C and O are primarily restricted to Asia, haplogroup N is present at high frequency in Finns (60.5%), at low frequency in non-Mongolian East Asians (< 1%), and virtually absent throughout the remainder of European and African samples in 1000G
Comparison with Finns
Of the populations included in our study, Mongolians share the second-highest level of IBD with the Finnish people (FIN), behind only Northern Han Chinese (CHB). While Mongolians share more IBD with Europeans (EUR) as a whole compared with other non-EAS people (Fig. 4b), removal of Finns from the Europeans drops the level of sharing to as low as that with South Asians (SAS) or Admixed American (AMR).
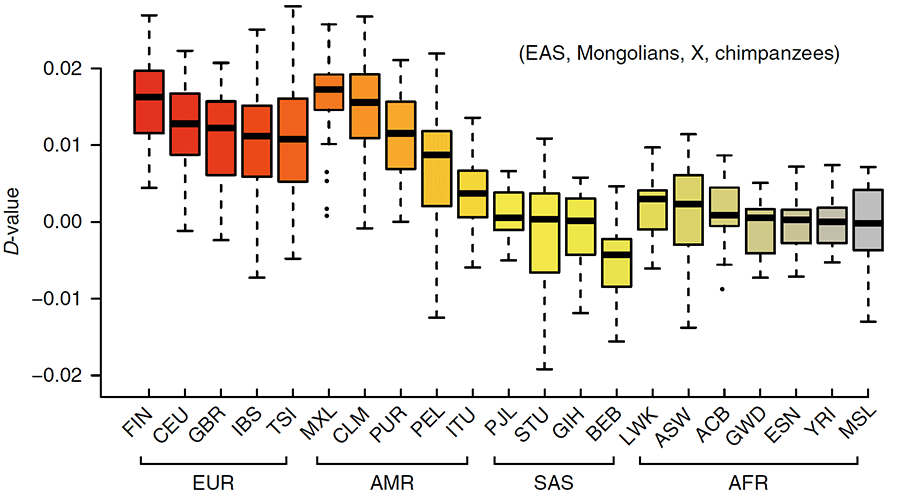
There is considerable geographic separation between modern-day Mongolians and Europe. The positive D-statistic that reveal gene flow between Mongolians and Europeans (Fig. 4c), and the high degree of IBD sharing with Finnish people in particular suggest that complex admixture may have occurred throughout northeastern Europe and Siberia. To see whether Mongolians represent the ethnic group in East Asia with the highest level of gene flow with Finnish people, we calculated a D-statistic for each set of populations [Mongolians, X, FIN, Yoruba (YRI)], where X represents a population from Siberia or Northern Canada. Most of the populations reveal an imbalance in allele frequencies that suggests gene flow with Finns (D >0, Z >3), but the greatest imbalance is observed between Siberians/Northern Canadians and Finnish, rather than between Mongolians and Finns. This pattern indicates that northern Asian populations interacted across large geographic ranges.
I guess the 1000G does not have northern Eurasian groups, because the IBD map and values would be lightening up with Palaeo-Siberian peoples…
Related
- Ancient nomadic tribes of the Mongolian steppe dominated by a single paternal lineage
- Y-DNA haplogroups of Tuvinian tribes show little effect of the Mongol expansion
- Corded Ware—Uralic (II): Finno-Permic and the expansion of N-L392/Siberian ancestry
- Corded Ware—Uralic (III): “Siberian ancestry” and Ugric-Samoyedic expansions
- Corded Ware—Uralic (IV): Haplogroups R1a and N in Finno-Ugric and Samoyedic
- Haplogroup R1a and CWC ancestry predominate in Fennic, Ugric, and Samoyedic groups
- The Iron Age expansion of Southern Siberian groups and ancestry with Scythians
- Evolution of Steppe, Neolithic, and Siberian ancestry in Eurasia (ISBA 8, 19th Sep)
- Mitogenomes from Avar nomadic elite show Inner Asian origin
- Oldest N1c1a1a-L392 samples and Siberian ancestry in Bronze Age Fennoscandia
- Genetic prehistory of the Baltic Sea region and Y-DNA: Corded Ware and R1a-Z645, Bronze Age and N1c
- More evidence on the recent arrival of haplogroup N and gradual replacement of R1a lineages in North-Eastern Europe