Yesterday the Eaton Lab at Columbia University announced on Twitter a nifty little tool by Carlos Alonso Maya-Lastra called TreeToM, which accepts Newick trees and CSV latitude/longitude data to explore phylogeny and geography interactively, with no coding required.
I thought it could complement nicely my All Ancient DNA Dataset, particularly for those newly described SNPs (FTDNA private variants, etc.) that have not been incorporated yet into SNP Tracker.
Here are two examples with snippets to copy&paste to the appropriate boxes in TreeToM. Feel free to add others in the comments:
A. Epipalaeolithic R1b-V2219, Neolithic R1b-V88
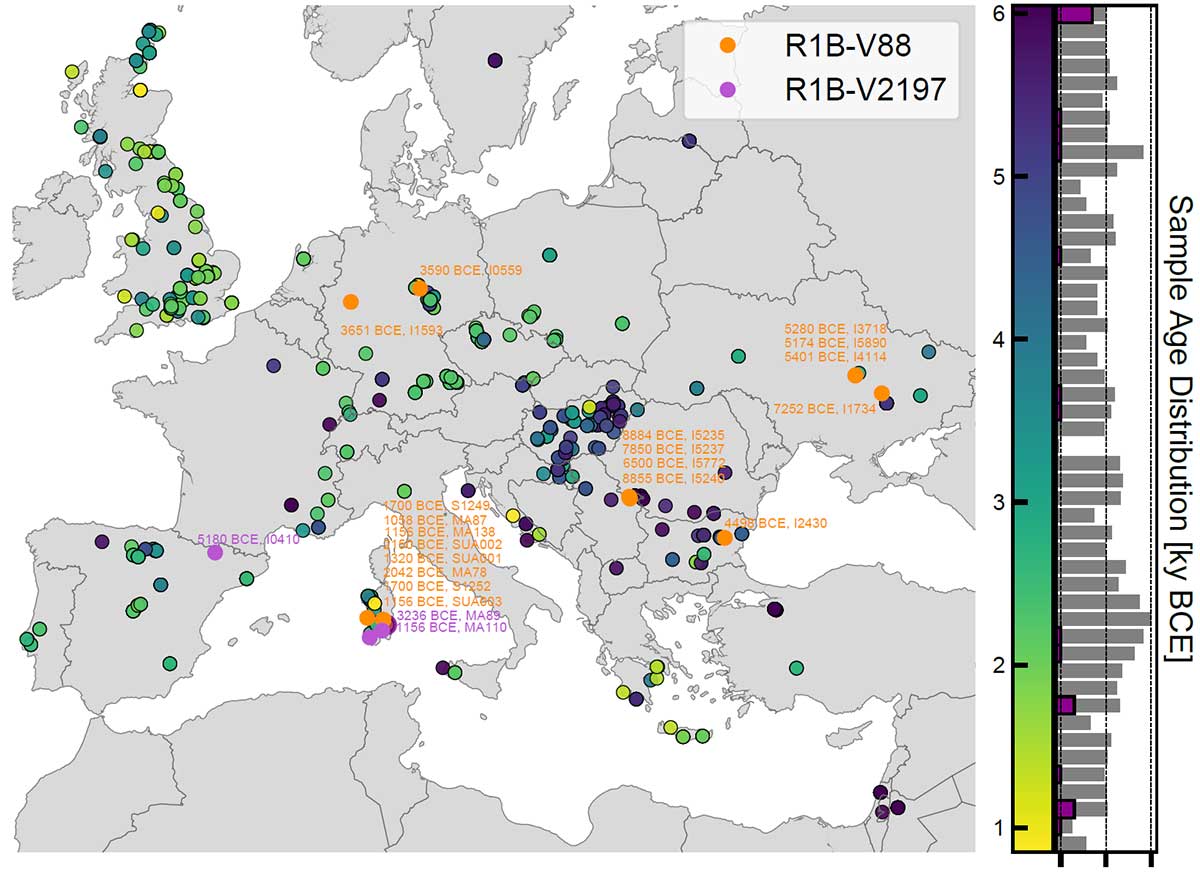
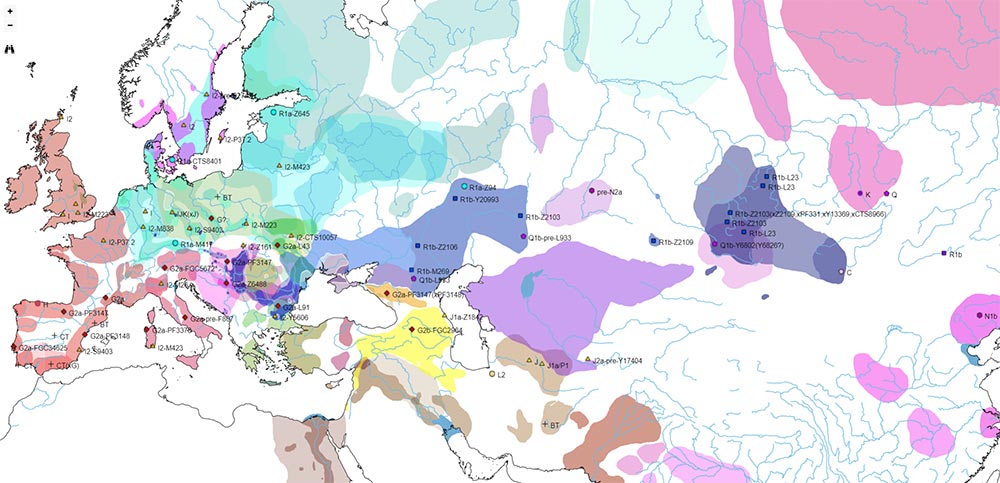
The map below was published in the recent Marcus et al. (2019), who were probably right in assuming that R1b-V88 expanded with the Neolithic, despite a simpler reasoning based on ADMIXTURE and on the distinction of SNP V2197 (currently an equivalent of FTDNA’s FGC21027 or YFull’s Y8451) within the R1b-(pre-)V88 trunk:
A.1. Phylogenetic tree
First, we need the most likely phylogenetic tree based on known SNPs. In this case, due to FTDNA and YFull lagging behind ancient DNA, Pribislav’s V2219 tree is the most precise description available to date:

Once we have a reasonable haplotree, we need to convert it to the Newick format (see specification here). There are as of today no estimated formation / TMRCA dates for all SNPs of the V2219 tree, so we will leave the tentatively described branches with the same node distance (hence the “0.1” in all).
NOTE. Blank spaces (imitating tabs) are only added for clarity. I have added node names as per the XML specification, but apparently TreeToM does not support it at this moment, nor does it seem to be common to display them in other tools using Newick trees.
('(L754)':0.01,

  ('V2219*':0.01,

  '(V2219)':0.01,

    ('PF6340*':0.01,

    '(PF6340)':0.01,

      ('Y8457*':0.1,

      '(Y8457)':0.1,

        ('V88*':0.1,

        '(V88)':0.1,

          ('M18*':0.1,

          '(M18)':0.1

        )M18:0.1,

          ('Y7777*':0.1,

          '(Y7777)',

            ('Y8451*':0.1,

            '(Y8451)':0.1,

            'Y8447':0.1,

              ('V35*':0.1,

              '(V35)':0.1

              )V35:0.1

            )Y8451:0.1

          )Y7777:0.1

        )V88:0.1

      )Y8457:0.1

    )PF6340:0.1

  )V2219:0.1

)L754;
A.2. Samples and latitude/longitude
Secondly, we need to sort the dataset by those samples under the old pre-R1b-V88 trunk, or R1b-L754 (xL388), i.e. within the recently described R1b-V2219 tree.
NOTE. I also included the Villabruna sample because of its most likely R1b-(pre-?)V2219 lineage, but not the LBK sample in Nikitin et al. (2019), whose subclade (if it is, in fact, of hg. R) is probably also well within the V2219 trunk.
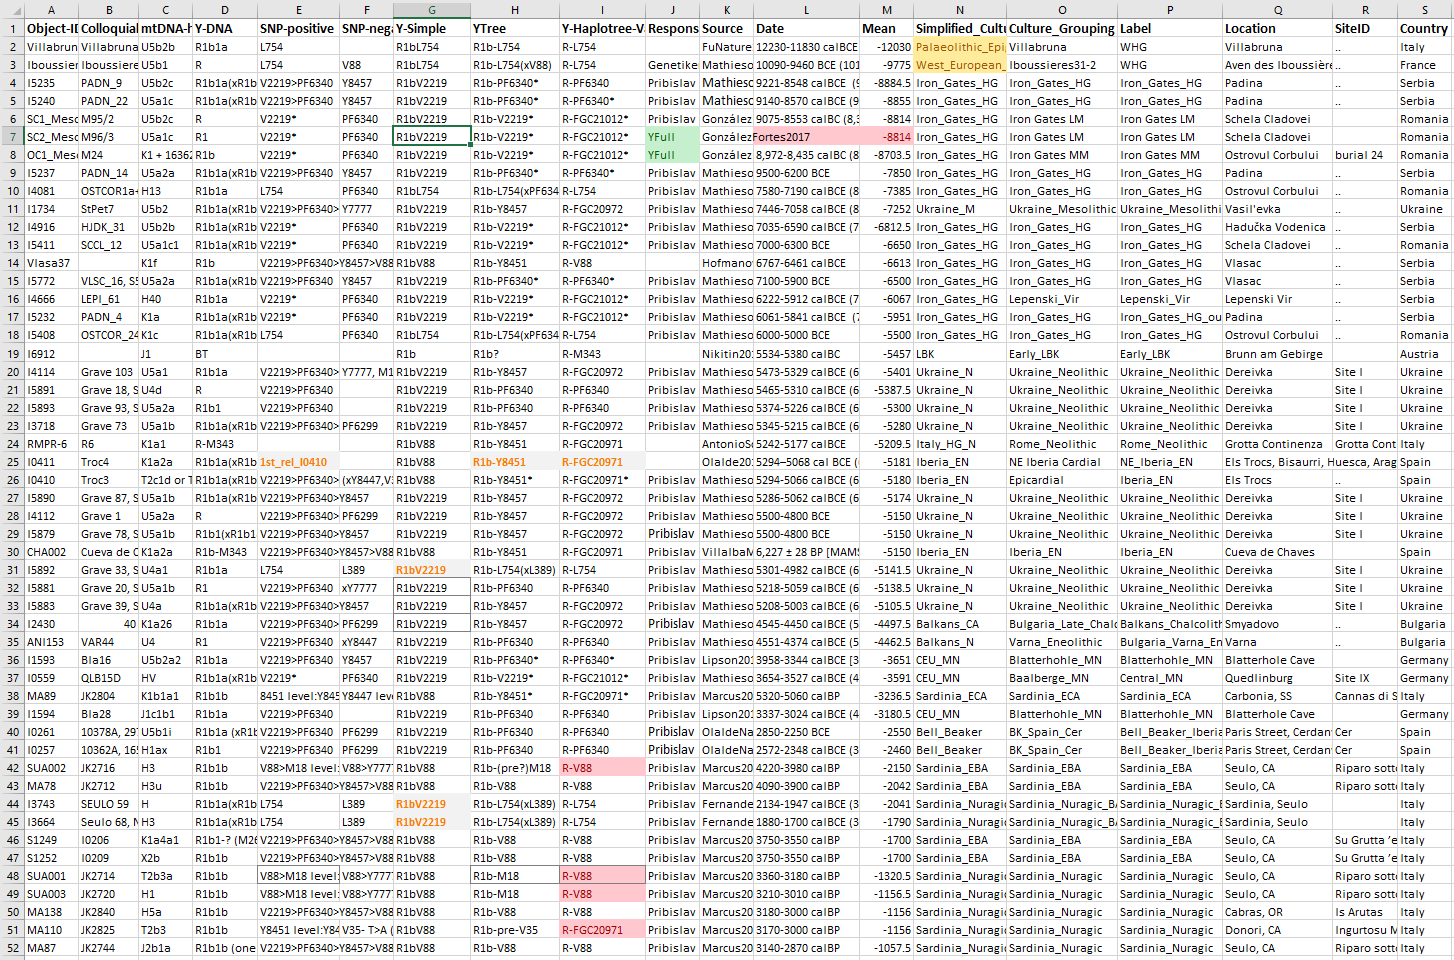
Now we can select only the columns with subclade (using the same name as for the SNP branches above), latitude, and longitude, and add another one with web colors, and then save the file as a comma-separated CSV, so that we have an output similar to this one:
(L754),46.15,12.21,black

V2219*,44.6258333,22.6066666,black

V2219*,44.6258333,22.6066666,black

V2219*,44.5154854,23.52087725,black

V2219*,44.640262,22.30333,black

V2219*,44.629711,22.6125561,black

V2219*,44.552924,22.027563,black

V2219*,44.595879,22.010568,black

V2219*,51.79,11.14,black

(V2219),48.91422,33.76493,green

(V2219),39.866642,9.233355,green

(V2219),39.866642,9.233355,green

(V2219),44.29,4.46,green

(V2219),44.517,22.722,green

(V2219),44.517,22.722,green

PF6340*,44.595879,22.010568,blue

PF6340*,44.595879,22.010568,blue

PF6340*,44.595879,22.010568,blue

PF6340*,44.53,22.05,blue

PF6340*,51.358333,7.551111,blue

(PF6340),48.91422,33.76493,#BA55D3

(PF6340),48.91422,33.76493,#BA55D4

(PF6340),48.91422,33.76493,#BA55D5

(PF6340),43.2131,27.8644,#BA55D6

(PF6340),51.358333,7.551111,#BA55D7

(PF6340),41.49194444,2.138888889,#BA55D8

(PF6340),41.49194444,2.138888889,#BA55D9

(Y8457),48.3,35.139,violet

(Y8457),48.91422,33.76493,violet

(Y8457),48.91422,33.76493,violet

(Y8457),48.91422,33.76493,violet

(Y8457),48.91422,33.76493,violet

(Y8457),48.91422,33.76493,violet

(Y8457),48.91422,33.76493,violet

(Y8457),43.05777778,26.98361111,violet

(V88),39.87,9.2356,red

(V88),39.86666667,9.233333333,red

(V88),39.86666667,9.233333333,red

(V88),39.9489,8.4022,red

(V88),39.87,9.2356,red

M18*,39.87,9.2356,brown

(M18),39.87,9.2356,#8B0000

(M18),39.87,9.2356,#8B0000

Y8451*,42.5,0.5,#E9967A

Y8451*,39.1632,8.5326,#E9967A

(Y8451),44.53,22.05,#F08080

(Y8451),41.96,13.54,#F08080

(Y8451),42.5,0.5,#F08080

(Y8451),42.7343714,-7.0305368,#F08080

V35*,39.4397,9.1688,orange
A.3. TreeToM output
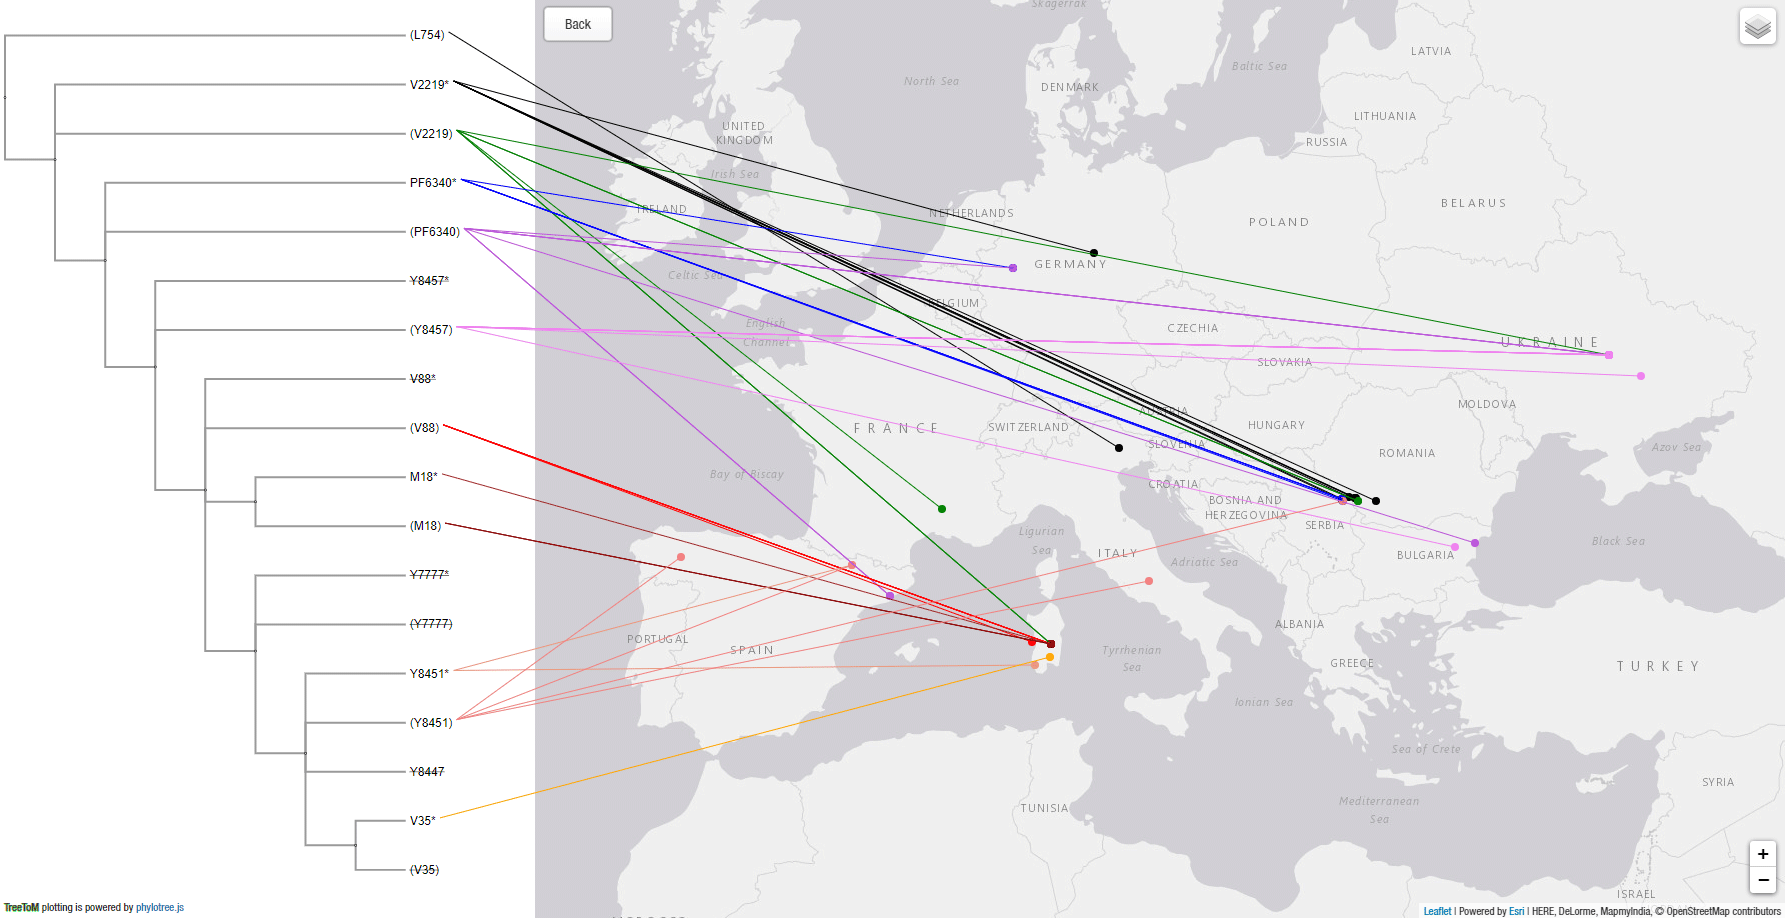
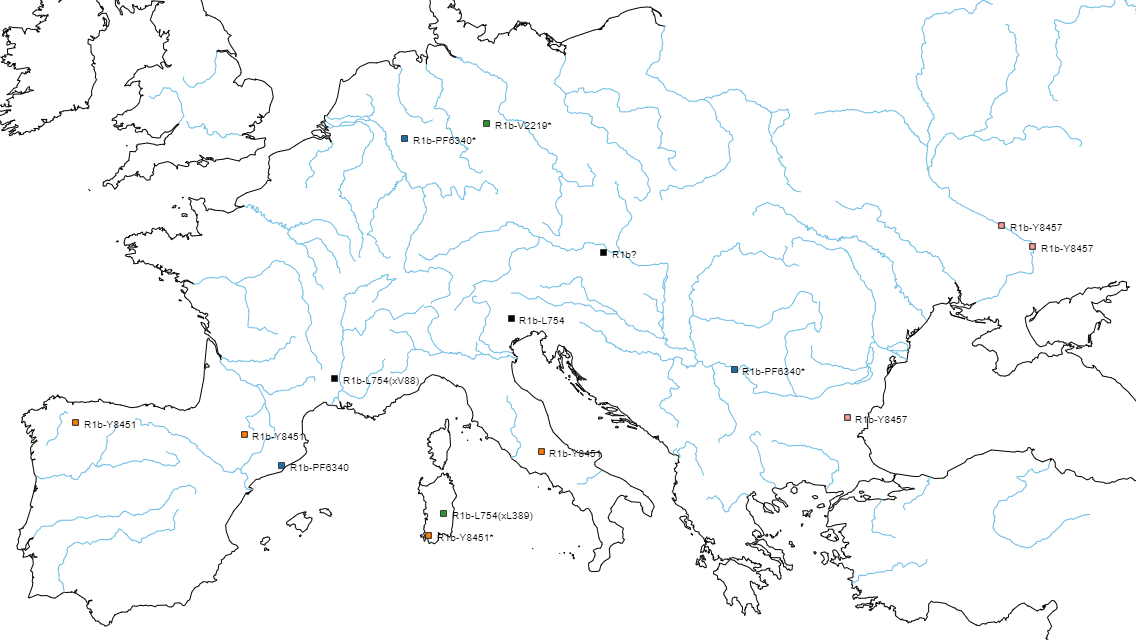
This is the output obtained by copy&pasting both snippets above in TreeToM:
You can also use a simpler tree and color scheme, for easier visualization:
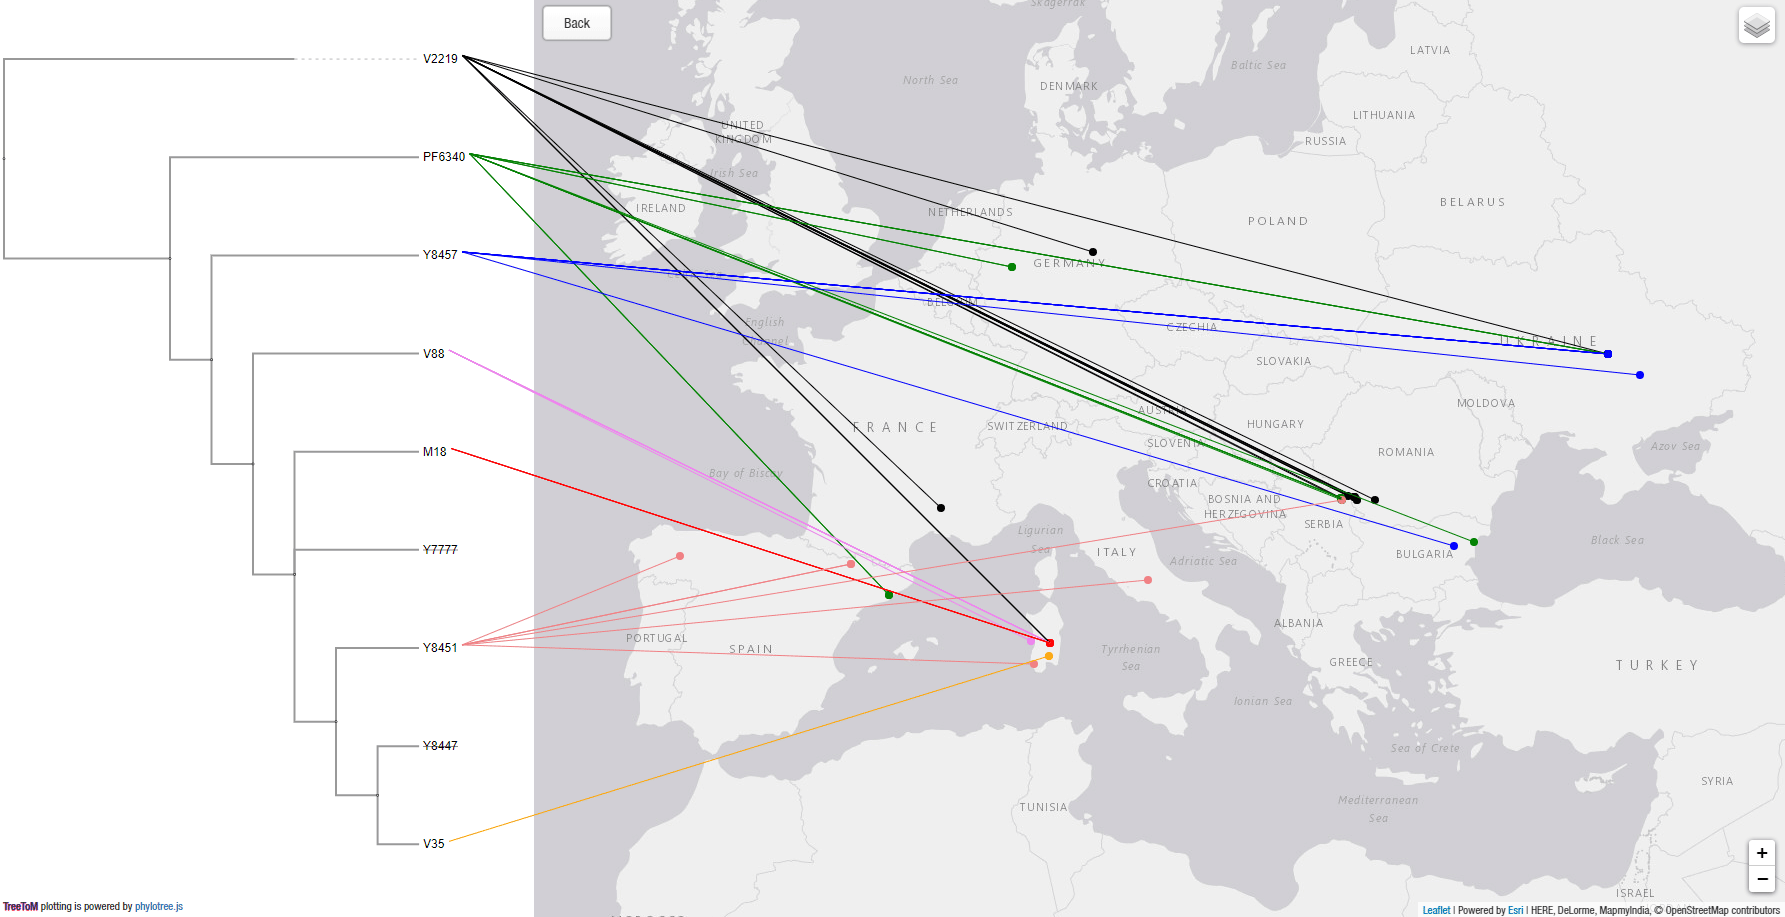
As can be readily seen, whereas R1b-V2219 lineages spread with the Epipalaeolithic expansion of WHG-related peoples, R1b-V88 and its subclades show a secondary bottleneck coinciding with the Neolithic expansion, crossing from Europe into Northern Africa most likely with impressed ware through the Central Mediterranean.
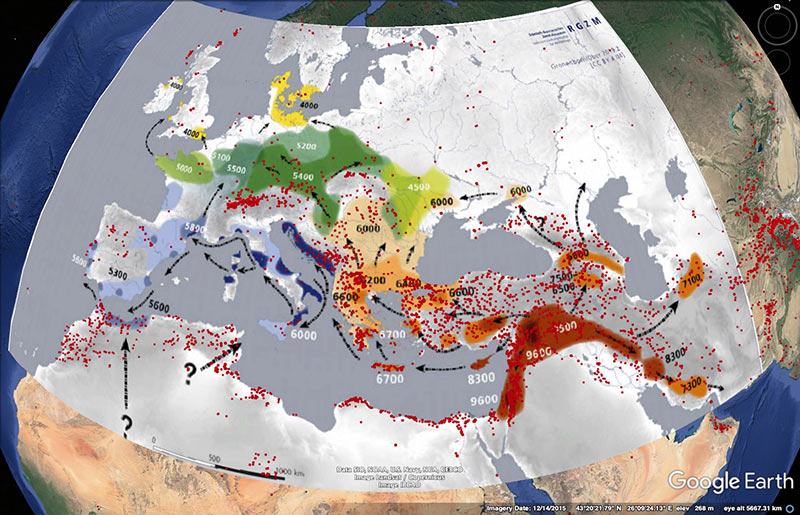
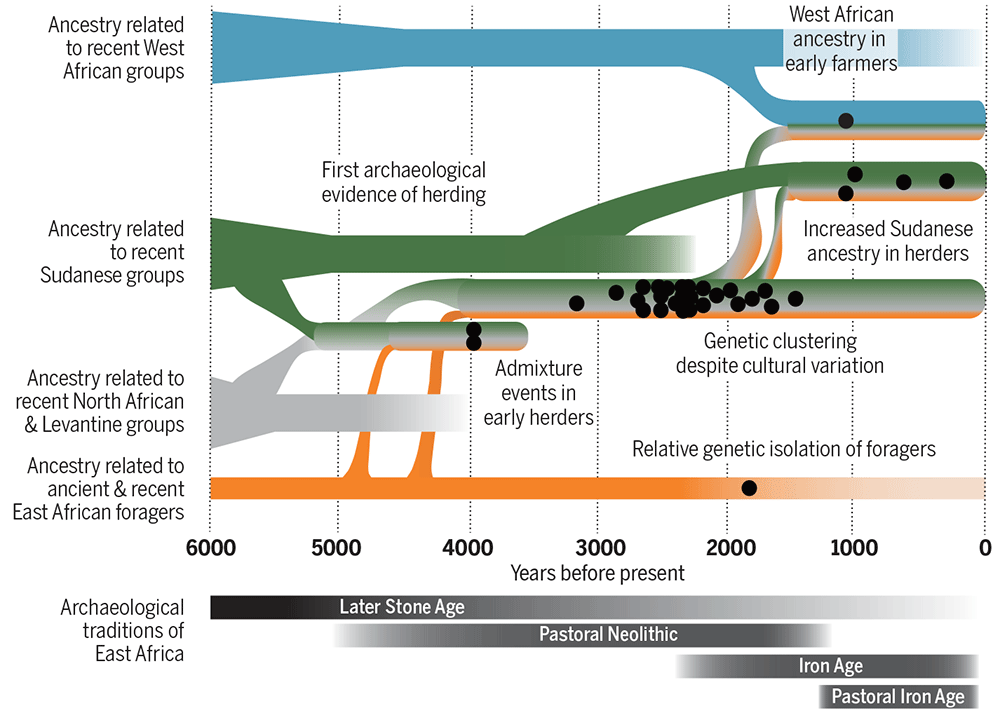
That puts an end to my attempts to integrate traditional views – such as the oft-cited Diakonoff (1998) – in tracing Proto-Afroasiatic to ca. 10000 BC (or even earlier!) to potential Mesolithic expansions, and further supports that the spread of Afro-Asiatic speakers was linked to pastoralist movements through the Green Sahara, as shown in Prendergast et al. (2019) and hinted by reconstructible PAA vocabulary.
NOTE. It seems quite fitting that population genomics helps dismiss the idea of a Stone Age Afro-Asiatic, as it helped dismiss the similarly (guesstimate-wise) far-fetched Anatolia Neolithic homeland for Proto-Indo-Europeans…
This complicates the picture in terms of male lineages because, as it is well-known by now, different Y-DNA bottlenecks can be observed in the spread of the Neolithic through the Mediterranean (and, it is to be assumed, through Northern Africa), including G2a, R1b, J2b, T1a, or E1b subclades, and that without taking into account potential East Mediterranean expansions directly from the Levant.
On the other hand, based on D’Atanasio et al. (2018), it seems that by the end of the Green Sahara period, only a handful of lineages show a Pan-African expansion compatible with a massive language replacement event.
A.4. Comparison with other maps
Although information on Y-DNA of ancient samples can be read directly from the All Ancient DNA Dataset, or visualized in context in the Prehistory Atlas, TreeToM offers a nice visualization that can help understand the geographic evolution of ancient SNPs.
For comparison, here is a dynamic OpenLayers map of samples in the R1b-V2219 trunk with a colour code similar to the one used above (click on the symbols to display more information):
You can also look for these samples in the ancient Y-DNA maps divided by ages:
For a clear picture of this haplogroup’s relevance in Africa, check out also the map of modern distribution of R1b-V88 in the maps of basal R1-M173 subclades.
B. Neolithic J2b-L283
At some point in late 2018 – 2019, it seemed possible that hg. J2b-L283 could have emerged as a minority among the R1b-rich Proto-Indo-Europeans of the Don–Volga region, but becoming more successful within Balkan EBA cultures, more or less like I2a-L699 or R1b-M269(xL23) lineages.
The discovery of a basal J2b-L283* in the Caucasus MBA sample reported by Wang et al. (2018) reinforced that idea, and no one could discard that – much like R1b-V1636 or R1a (xM417) – there wouldn’t be some other minor lineages expanding with Khvalynsk and (later) Yamnaya. The TMRCA of European clades was particularly fitting.
However, the ancient Sardinian samples reported in Marcus et al. (2019) – showing basal subclades and no Steppe ancestry – have shattered that expectation, and the Khvalynsk sample of hg. J reported by Anthony (2019) turned out to be J1.
In fact, the reported Etruscan from Civitavecchia by Antonio et al. (2019) complicates things further, because it is of the same subclade as the Balkan BA sample from Veliki Vanik, potentially evidencing a wider distribution of J2b-Y15058 among non-homogeneous Southern European Bronze Age communities.
B.1. Phylogenetic tree
This is a simplistic Newick tree made from YFull’s current public tree for J2b-L283:
NOTE. Node distances have been selected for better visualization, not (as they should) by taking estimated formation or TMRCA dates into account. For simplicity purposes, this tree does not include basal subclades – which would be essential to visualize the proper migration paths if there were many samples available.
('L283*':0.6,

'L283':0.6,

  ('YP91':0.7

  )YP91:0.1,

  ('Z600':0.7,

    ('YP157':0.6

    )YP157:0.1,

    ('Z585':0.1,

      ('Z615':0.1,

        ('Z597':0.1,

          ('Z2507':0.1,

            ('Y15058':0.1,

              ('Z38240':0.1,

                ('CTS6190':0.1

                )CTS6190:0.1

              )Z38240:0.1

            )Y15058:0.1

          )Z2507:0.1,

          ('Z638':0.1,

            ('Z1297':0.1,

              ('Y27522':0.1,

                ('Y23094':0.1

                )Y23094:0.1

              )Y27522:0.1,

              ('Z1295':0.1,

                ('Z8421':0.1,

                  ('Z631':0.1

                  )Z8421:0.1

                )Z8421:0.1

              )Z1295:0.1

            )Z1297:0.1

          )Z638:0.1

        )Z597:0.1

      )Z615:0.1

    )Z585:0.1

  )Z600:0.1

)L283;
B.2. Ancient samples
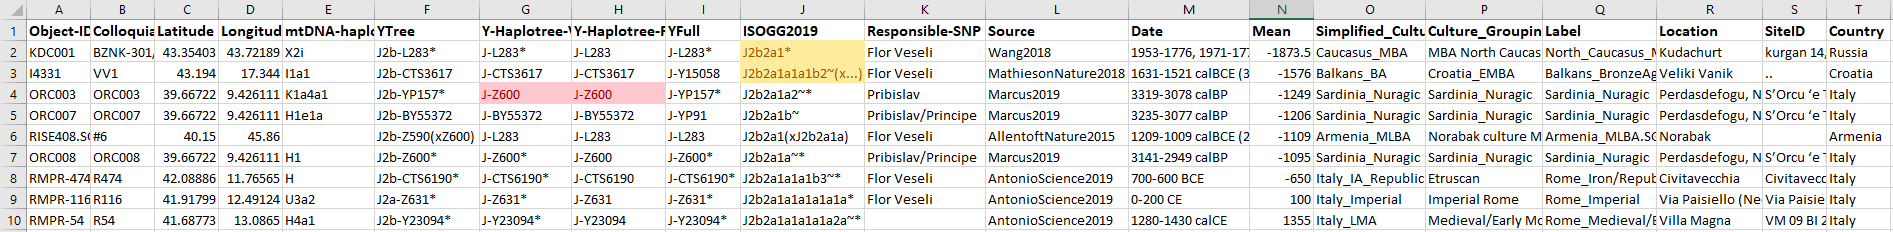
These are J2b-L283 lineages selected from the All Ancient DNA Dataset:
L283,40.15,45.86,green

L283*,43.354032,43.721893,black

Z600,39.667222,9.426111,blue

Z631,41.9179937,12.4912439,orange

Y23094,41.6877312,13.0864953,brown

Y15058,43.194,17.344,red

CTS6190,42.0888597,11.7656459,violet

YP157,39.667222,9.426111,aqua

YP91,39.667222,9.426111,lime
B.3. TreeToM output
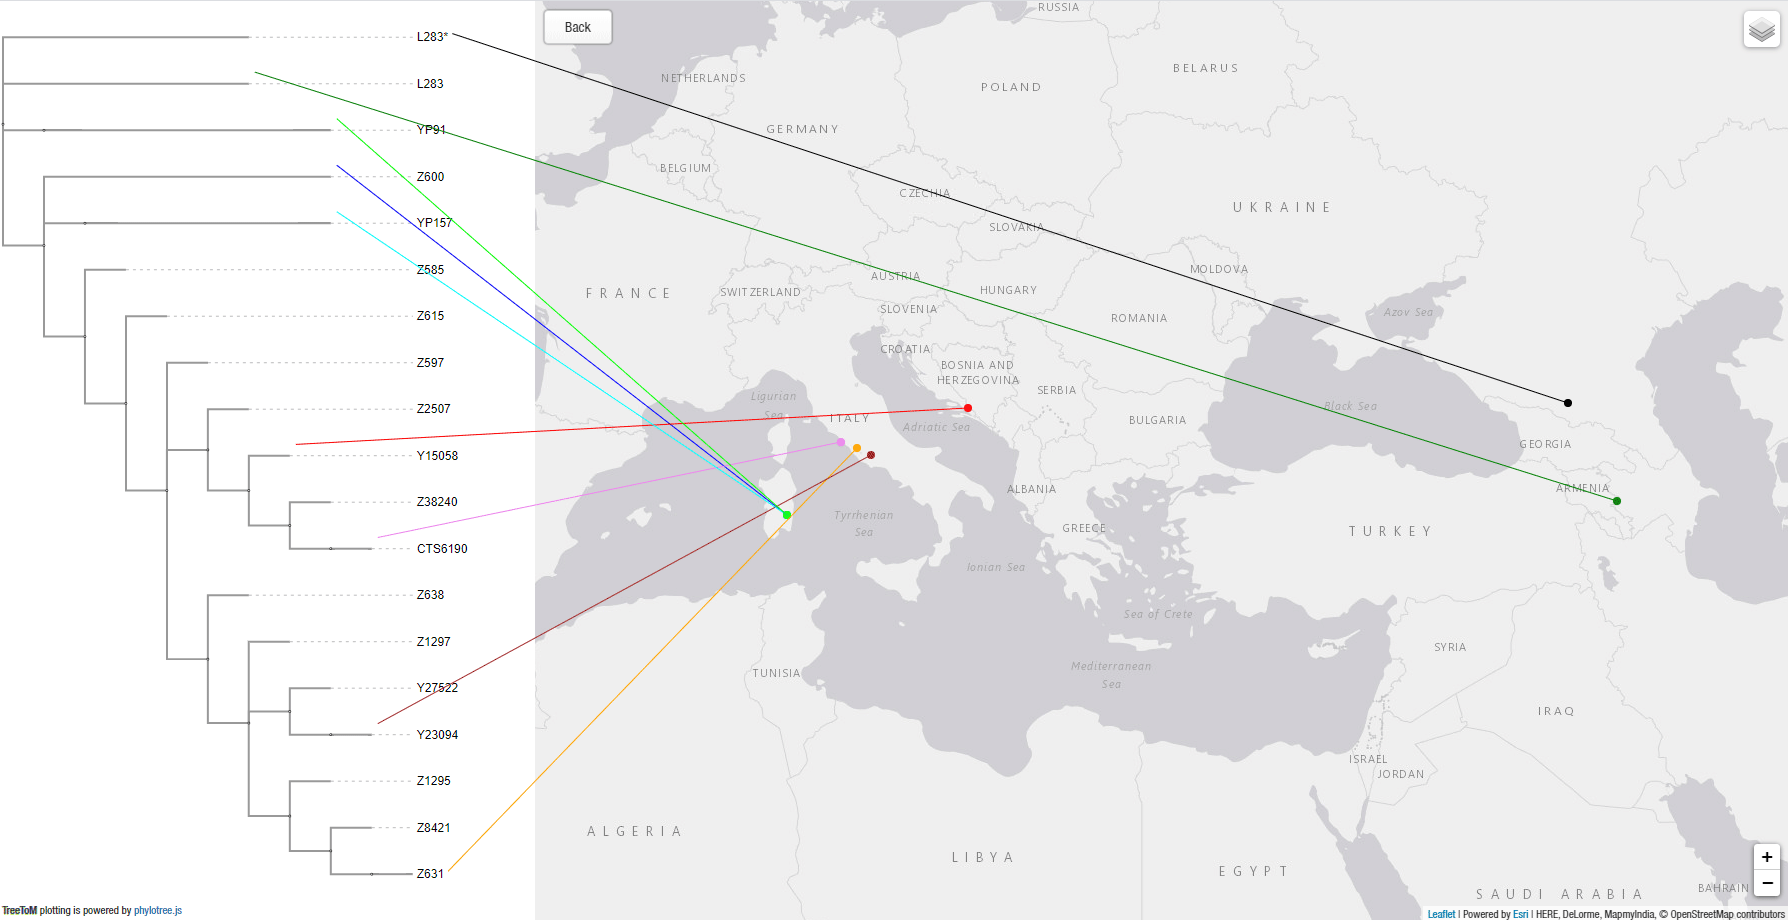
This is the output obtained by copy&pasting both snippets above in TreeToM:
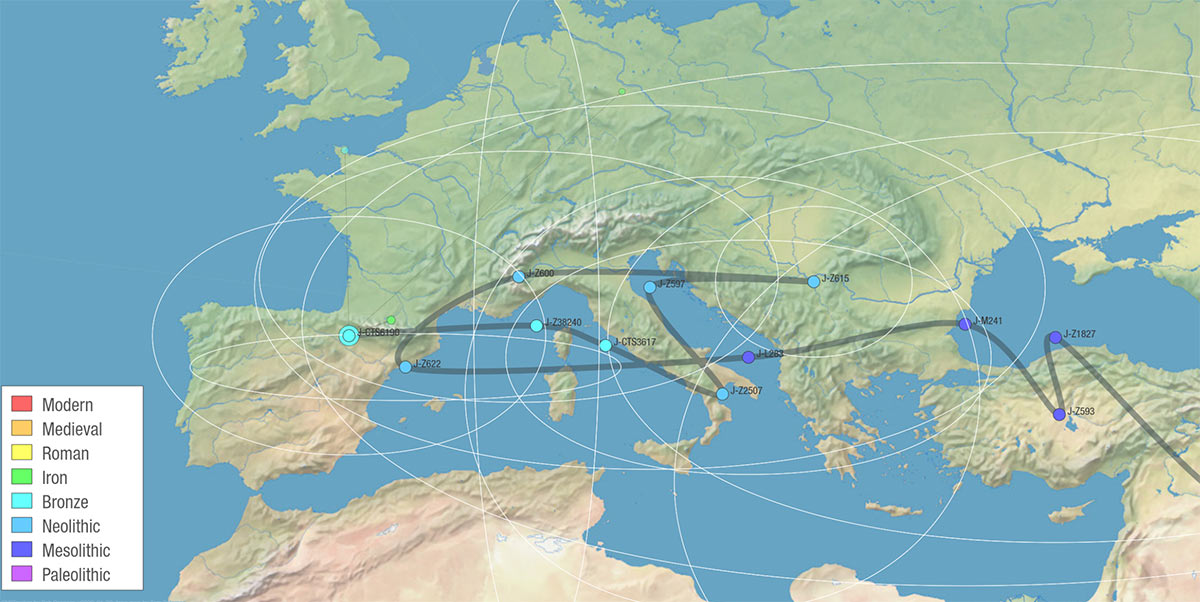
B. 4. Comparison with other tools
For comparison, here is the path created by SNP Tracker for J-Z631 based on modern descendants, following FTDNA’s public Y-DNA haplotree, showing uncertainty areas:
![]()
And here is path of SNP Tracker for J2b-CTS6190, the subclade found in the Etruscan sample from Civitavecchia (zoomed to Europe):
Referencing TreeToM
How to cite TreToM, according to the author on Twitter:
Maya-Lastra, C. A. 2020. TreeToM, Simple tool for visualizing phylogenetic trees onto a map. camayal.info/wa/treetom/
See also
- Ancient Sardinia hints at Mesolithic spread of R1b-V88, and Western EEF-related expansion of Vasconic
- R1b-L23-rich Bell Beaker-derived Italic peoples from the West vs. Etruscans from the East
- Villabruna cluster in Late Epigravettian Sicily supports South Italian corridor for R1b-V88
- Sahara’s rather pale-green and discontinuous Sahelo-Sudanian steppe corridor, and the R1b – Afroasiatic connection
- R1b-V88 migration through Southern Italy into Green Sahara corridor, and the Afroasiatic connection
- Fulani from Cameroon show ancestry similar to Afroasiatic speakers from East Africa
- Ancient genomes from North Africa evidence Neolithic migrations to the Maghreb
- Tales of Human Migration, Admixture, and Selection in Africa
- Pleistocene North African genomes link Near Eastern and sub-Saharan African human populations
- Genetic ancestry of Hadza and Sandawe peoples reveals ancient population structure in Africa
- Potential Afroasiatic Urheimat near Lake Megachad