The expansion of peoples is known to be associated with the spread of a certain admixture component, joint with the expansion and reduction in variability of a haplogroup. In other words, few male lineages are usually more successful during the expansion.
Known examples include:
- Neolithic farmers from the Middle East expanding with haplogroup G2a;
- Natufian component (Levant hunter-gatherers or later, Neolithic farmers) and haplogroup E southward into Africa;
- CHG component expansion with haplogroup J;
- WHG expansion into east Europe in the Palaeolithic and Mesolithic with haplogroup R1b;
- The expansion of “steppe component” with the Corded Ware culture and haplogroup R1a-M417, probably corresponding to the spread of Uralic languages;
- The expansion of “steppe component” with Yamna (and later Bell Beaker) migrants of haplogroup R1b-L23, corresponding to the spread of Late Indo-European languages.
Two recent interesting papers add prehistoric cases of potential expansion of cultures associated with haplogroups:
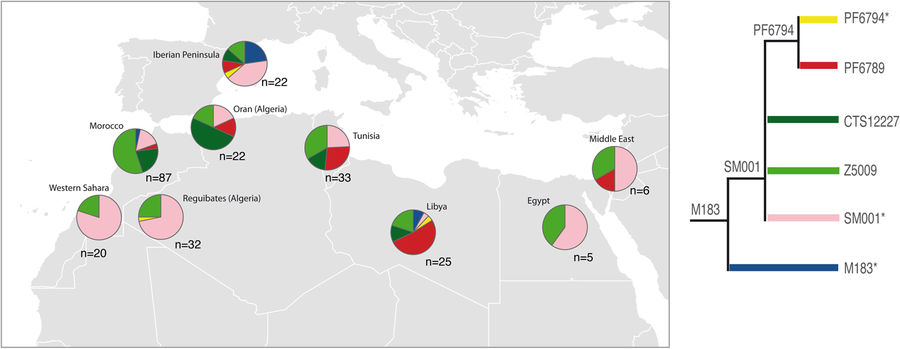
1. Whole Y-chromosome sequences reveal an extremely recent origin of the most common North African paternal lineage E-M183 (M81), by Solé-Morata et al., Scientific Reports (2017).
Abstract:
E-M183 (E-M81) is the most frequent paternal lineage in North Africa and thus it must be considered to explore past historical and demographical processes. Here, by using whole Y chromosome sequences from 32 North African individuals, we have identified five new branches within E-M183. The validation of these variants in more than 200 North African samples, from which we also have information of 13 Y-STRs, has revealed a strong resemblance among E-M183 Y-STR haplotypes that pointed to a rapid expansion of this haplogroup. Moreover, for the first time, by using both SNP and STR data, we have provided updated estimates of the times-to-the-most-recent-common-ancestor (TMRCA) for E-M183, which evidenced an extremely recent origin of this haplogroup (2,000–3,000 ya). Our results also showed a lack of population structure within the E-M183 branch, which could be explained by the recent and rapid expansion of this haplogroup. In spite of a reduction in STR heterozygosity towards the West, which would point to an origin in the Near East, ancient DNA evidence together with our TMRCA estimates point to a local origin of E-M183 in NW Africa.
An interesting excerpt, from the discussion:
Regarding the geographical origin of E-M183, a previous study suggested that an expansion from the Near East could explain the observed east-west cline of genetic variation that extends into the Near East. Indeed, our results also showed a reduction in STR heterozygosity towards the West, which may be taken to support the hypothesis of an expansion from the Near East. In addition, previous studies based on genome-wide SNPs reported that a North African autochthonous component increase towards the West whereas the Near Eastern decreases towards the same direction, which again support an expansion from the Near East. However, our correlations should be taken carefully because our analysis includes only six locations on the longitudinal axis, none from the Near East. As a result, we do not have sufficient statistical power to confirm a Near Eastern origin. In addition, rather than showing a west-to-east cline of genetic diversity, the overall picture shown by this correlation analysis evidences just low genetic diversity in Western Sahara, which indeed could be also caused by the small sample size (n = 26) in this region. Alternatively, given the high frequency of E-M183 in the Maghreb, a local origin of E-M183 in NW Africa could be envisaged, which would fit the clear pattern of longitudinal isolation by distance reported in genome-wide studies. Moreover, the presence of autochthonous North African E-M81 lineages in the indigenous population of the Canary Islands, strongly points to North Africa as the most probable origin of the Guanche ancestors. This, together with the fact that the oldest indigenous inviduals have been dated 2210 ± 60 ya, supports a local origin of E-M183 in NW Africa. Within this scenario, it is also worth to mention that the paternal lineage of an early Neolithic Moroccan individual appeared to be distantly related to the typically North African E-M81 haplogroup30, suggesting again a NW African origin of E-M183. A local origin of E-M183 in NW Africa > 2200 ya is supported by our TMRCA estimates, which can be taken as 2,000–3,000, depending on the data, methods, and mutation rates used.
The TMRCA estimates of a certain haplogroup and its subbranches provide some constraints on the times of their origin and spread. Although our time estimates for E-M78 are slightly different depending on the mutation rate used, their confidence intervals overlap and the dates obtained are in agreement with those obtained by Trombetta et al Regarding E-M183, as mentioned above, we cannot discard an expansion from the Near East and, if so, according to our time estimates, it could have been brought by the Islamic expansion on the 7th century, but definitely not with the Neolithic expansion, which appeared in NW Africa ~7400 BP and may have featured a strong Epipaleolithic persistence. Moreover, such a recent appearance of E-M183 in NW Africa would fit with the patterns observed in the rest of the genome, where an extensive, male-biased Near Eastern admixture event is registered ~1300 ya, coincidental with the Arab expansion. An alternative hypothesis would involve that E-M183 was originated somewhere in Northwest Africa and then spread through all the region. Our time estimates for the origin of this haplogroup overlap with the end of the third Punic War (146 BCE), when Carthage (in current Tunisia) was defeated and destroyed, which marked the beginning of Roman hegemony of the Mediterranean Sea. About 2,000 ya North Africa was one of the wealthiest Roman provinces and E-M183 may have experienced the resulting population growth.
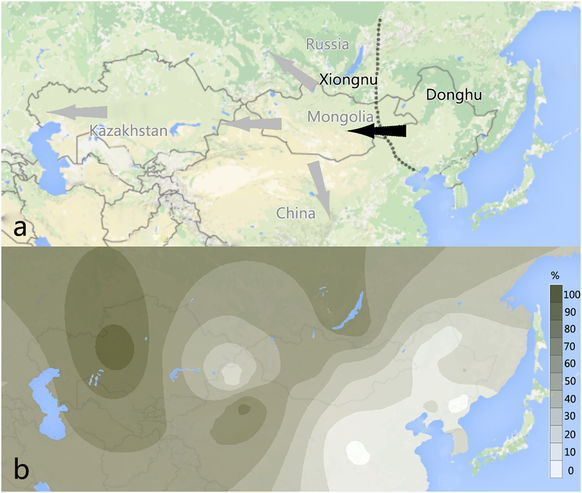
2. The Y-chromosome haplogroup C3*-F3918, likely attributed to the Mongol Empire, can be traced to a 2500-year-old nomadic group, by Zhang et al., Journal of Human Genetics (2017)
Abstract:
The Mongol Empire had a significant role in shaping the landscape of modern populations. Many populations living in Eurasia may have been the product of population mixture between ancient Mongolians and natives following the expansion of Mongol Empire. Geneticists have found that most of these populations carried the Y-haplogroup C3* (C-M217). To trace the history of haplogroup (Hg) C3* and to further understand the origin and development of Mongolians, ancient human remains from the Jinggouzi, Chenwugou and Gangga archaeological sites, which belonged to the Donghu, Xianbei and Shiwei, respectively, were analysed. Our results show that nine of the eleven males of the Gangga site, two of the eight males of Chengwugou site and all of the twelve males of Jinggouzi site were found to have mutations at M130 (Hg C), M217 (Hg C3), L1373 (C2b, ISOGG2015), with the absence of mutations at M93 (Hg C3a), P39 (Hg C3b), M48 (Hg C3c), M407 (Hg C3d) and P62 (Hg C3f). These samples were attributed to the Y-chromosome Hg C3* (Hg C2b, ISOGG2015), and most of them were further typed as Hg C2b1a based on the mutation at F3918. Finally, we inferred that the Y-chromosome Hg C3*-F3918 can trace its origins to the Donghu ancient nomadic group.
Featured image: Diachronic map of Iron Age migrations ca. 750-250 BC.
Related:
- Indo-European demic diffusion model, 3rd edition (revised October 2017)
- New Ukraine Eneolithic sample from late Sredni Stog, near homeland of the Corded Ware culture
- The renewed ‘Kurgan model’ of Kristian Kristiansen and the Danish school: “The Indo-European Corded Ware Theory”
- Correlation does not mean causation: the damage of the ‘Yamnaya ancestral component’, and the ‘Future America’ hypothesis
- Something is very wrong with models based on the so-called ‘steppe admixture’ – and archaeologists are catching up
- Germanic–Balto-Slavic and Satem (‘Indo-Slavonic’) dialect revisionism by amateur geneticists, or why R1a lineages *must* have spoken Proto-Indo-European
- Heyd, Mallory, and Prescott were right about Bell Beakers