The role of matrilineality in shaping patterns of Y chromosome and mtDNA sequence variation in southwestern Angola, by Oliveira et al. bioRxiv (2018).
Interesting excerpts (emphasis mine):
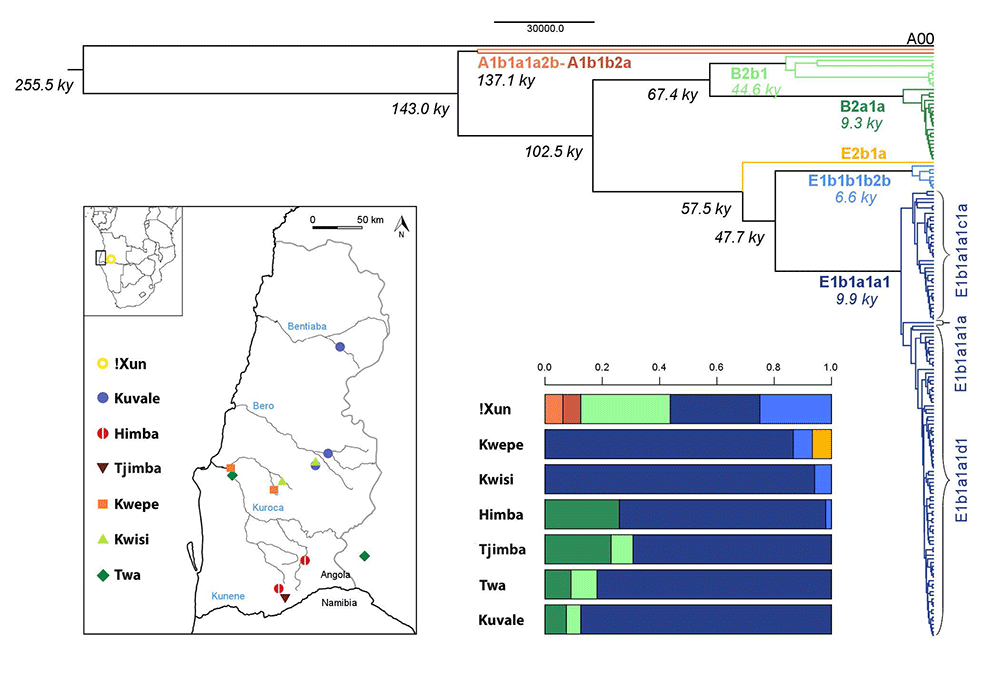
The origins of NRY diversity in SW Angola
In accordance with our previous mtDNA study9, the present NRY analysis reveals a major division between the Kx’a-speaking !Xun and the Bantu-speaking groups, whose paternal genetic ancestry does not display any old remnant lineages, or a clear link to pre-Bantu eastern African migrants introducing Khoe-Kwadi languages and pastoralism into southern Africa (cf. 15). This is especially evident in the distribution of the eastern African subhaplogroup E1b1b1b2b29, which reaches the highest frequency in the !Xun (25%) and not in the formerly Kwadi-speaking Kwepe (7%). This observation, together with recent genome-wide estimates of 9-22% of eastern African ancestry in other Kx’a and Tuu-speaking groups35, suggests that eastern African admixture was not restricted to present-day Khoe-Kwadi speakers. Alternatively, it is likely that the dispersal of pastoralism and Khoe-Kwadi languages involved a series of punctuated contacts that led to a wide variety of cultural, genetic and linguistic outcomes, including possible shifts to Khoe-Kwadi by originally Bantu-speaking peoples36.
Although traces of an ancestral pre-Bantu population may yet be found in autosomal genome-wide studies, the extant variation in both uniparental markers strongly supports a scenario in which all groups of the Angolan Namib share most of their genetic ancestry with other Bantu groups but became increasingly differentiated within the highly stratified social context of SW African pastoral societies11.
The influence of socio-cultural behaviors on the diversity of NRY and mtDNA
A comparison of the NRY variation with previous mtDNA results for the same groups 9 identifies three main sex-specific patterns. First, gene flow from the Bantu into the !Xun is much higher for male than for female lineages (31% NRY vs. 3% mtDNA), similar to the reported male-biased patterns of gene flow from Bantu to Khoisan-speaking groups33, and from non-Pygmies to Pygmies in Central Africa 37. A comparable trend, involving exclusive introgression of NRY eastern African lineages into the !Xun (25%) was also found. (…)
Secondly, the levels of intrapopulation diversity in the Bantu-speaking peoples from the Namib were found to be consistently higher for mtDNA than for the NRY, reflecting the marked association between the Bantu expansion and the relatively young NRY E1b1a1a1 haplogroup, which has no parallel in mtDNA25,39. (…)
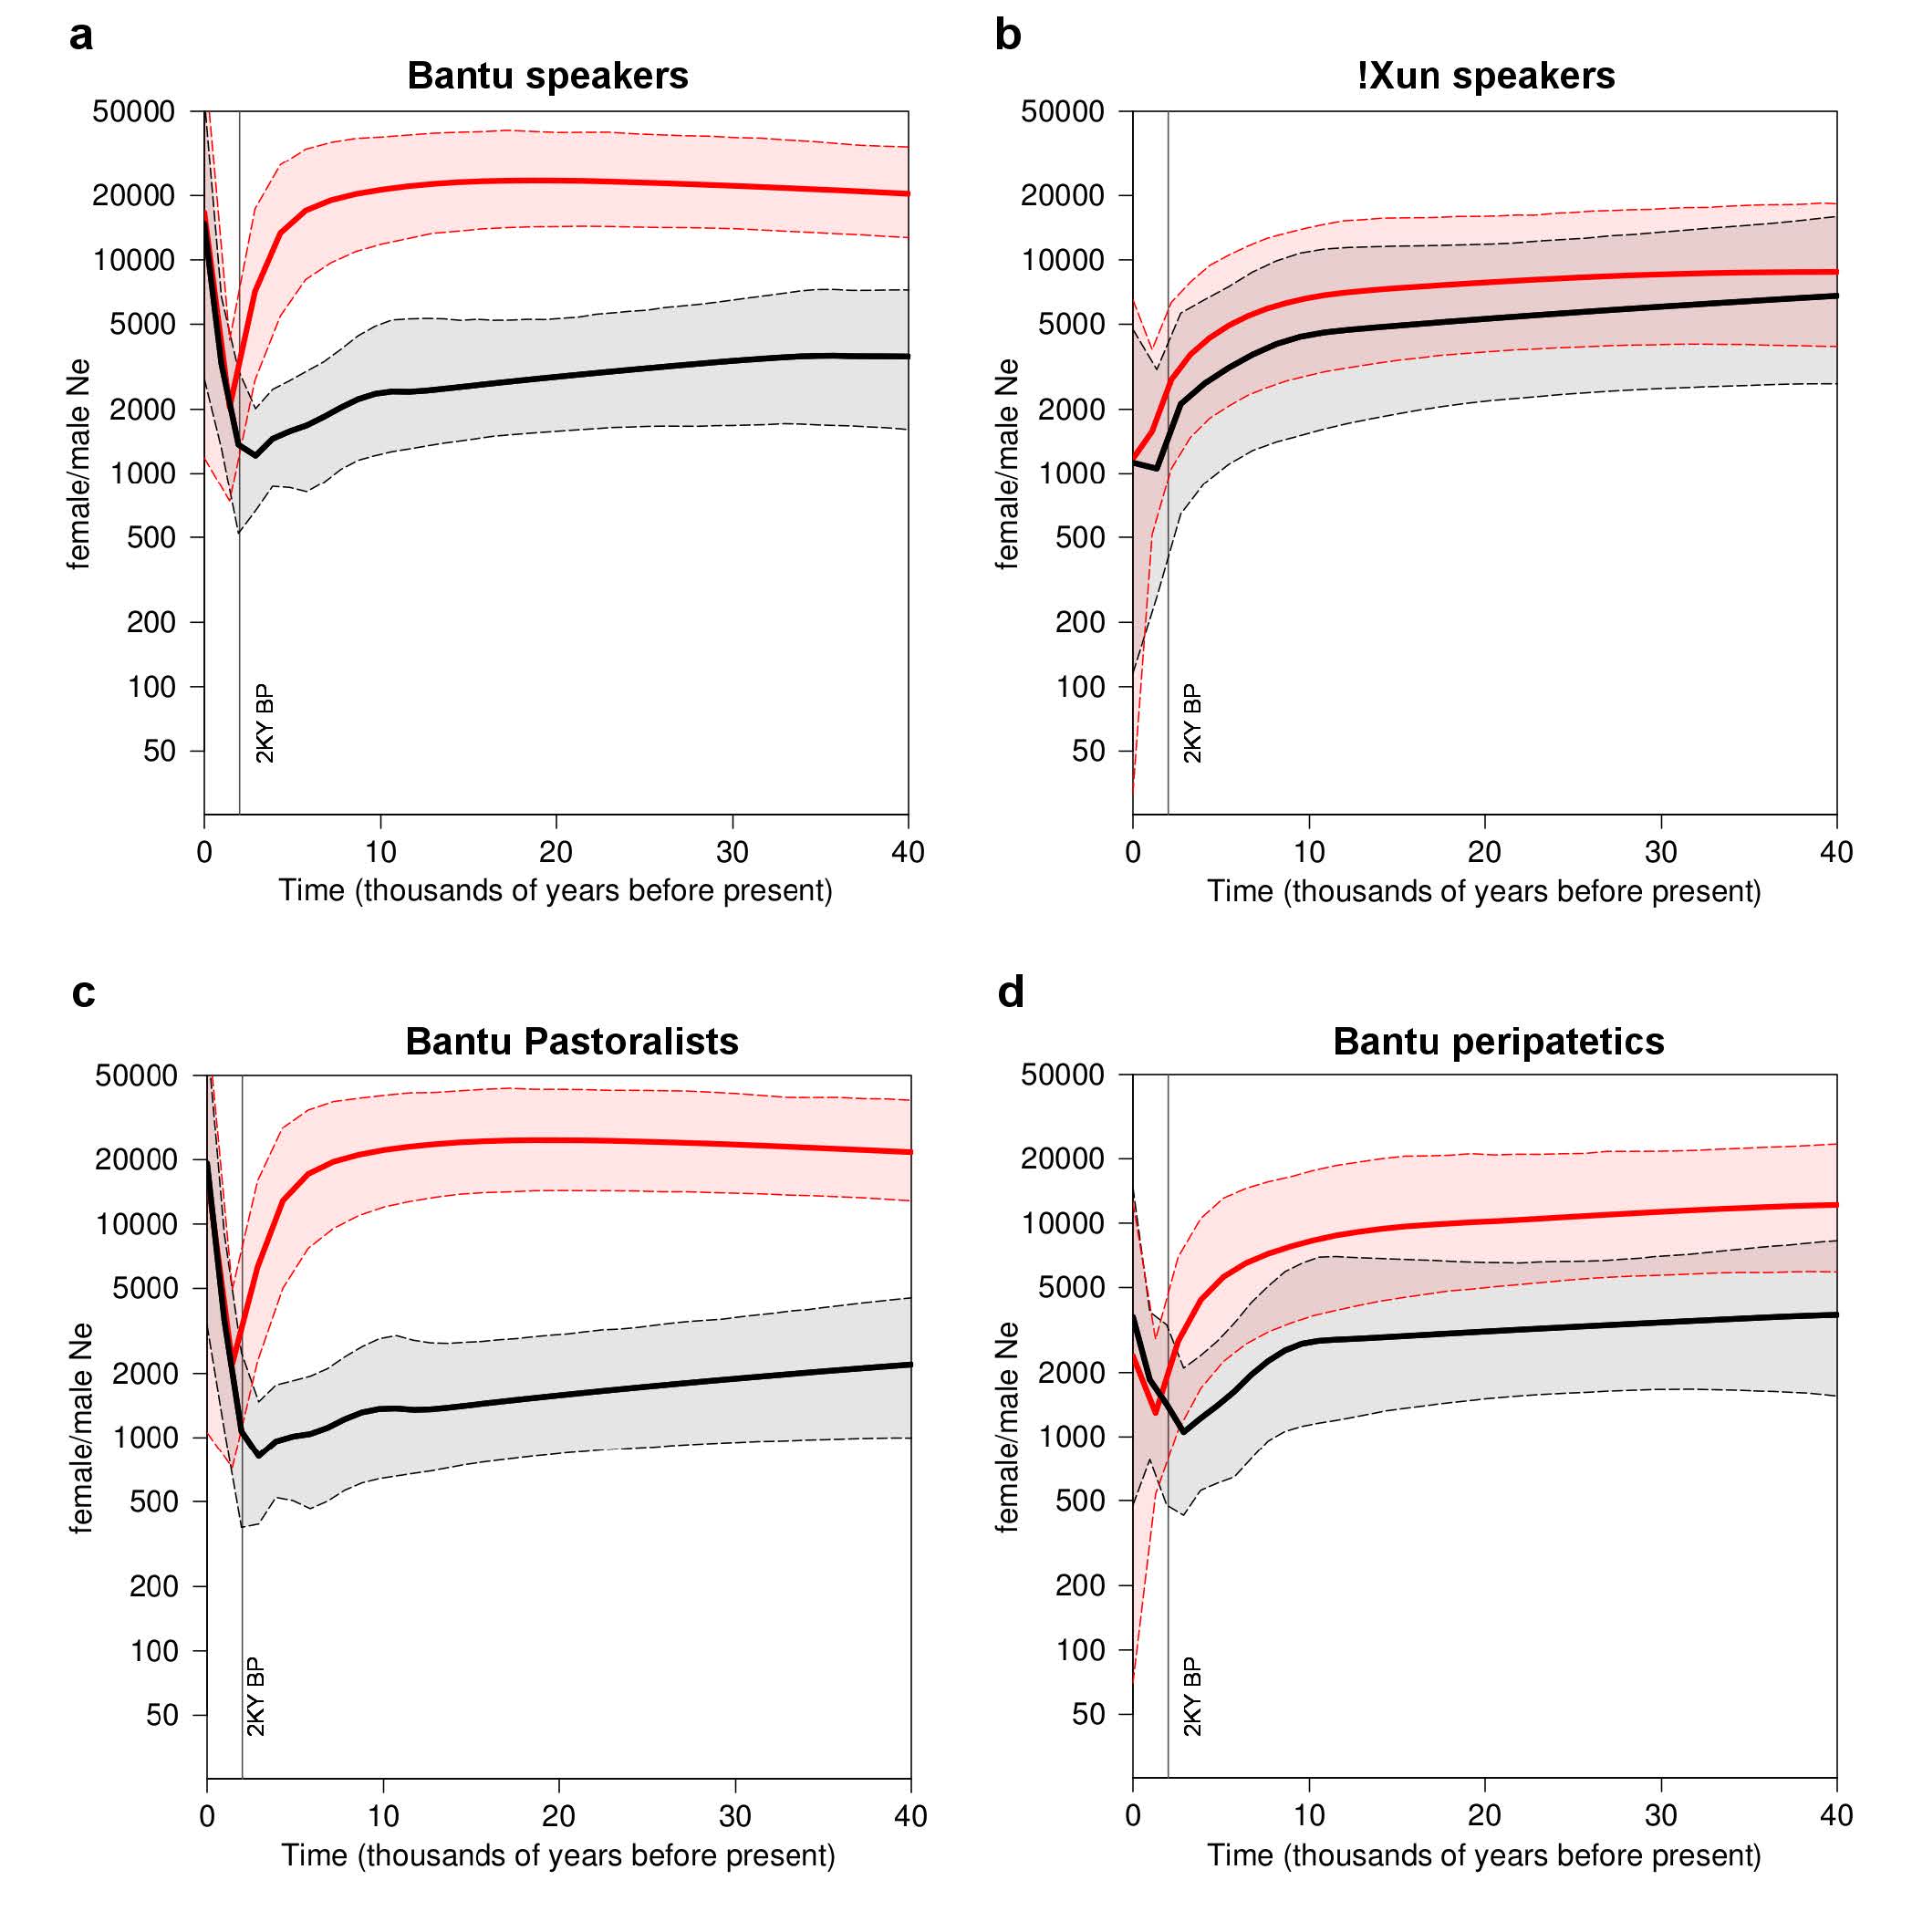
In the context of the Bantu expansions, these patterns have been mostly interpreted as the result of polygyny and/or higher levels of assimilation of females from resident forager communities38,40. However, most groups from the Angolan Namib are only mildly polygynous11 and ethnographic data suggest that the actual rates of polygyny in many populations may be insufficient to significantly reduce Nem2,41. In addition, the finding of a large Nef/ Nem ratio in the Himba (Fig. S5), who have almost no Khoisan-related mtDNA lineages9, indicates that female biased introgression cannot fully explain the observed patterns.
An alternative explanation may be sought in the prevailing matrilineal descent rules, which might have created a sex-specific structuring effect, similar to that proposed for patrilineal groups from Central Asia (…)
The third important sex-specific pattern observed in this study is the much lower amount of between-group differentiation for NRY than for mtDNA among Bantu-speaking populations (4.4% NRY vs. 20.2% mtDNA), in spite of the patrilocal residence patterns of all ethnic groups (Table S5). This difference can hardly be explained by unequal levels of introgression of “Khoisan” mtDNA lineages into the Bantu, since the percentage of mtDNA variation remains high (18.8%) when the Kuvale, who have high frequencies of “Khoisan”-related mtDNA, are excluded from the comparisons. It therefore seems more plausible that differentiation is higher in the mtDNA simply because there is more ancestral mtDNA than NRY variation that can be sorted among different populations (see 45). Moreover, due to the matriclanic organization of all Bantu-speaking communities, factors enhancing inter-group differentiation, like kin-structured migration and kin-structured founder effects46, would have been restricted to mtDNA. Finally, it is also likely that the discrepancy between among-group divergence of mtDNA and NRY might have been influenced by higher migration rates in males than females. In fact, although all Bantu-speaking populations have patrilocal residence patterns, the observance of endogamy rules severely constrains the between-group mobility of females. In this context, the children from extramarital unions involving members from different populations tend to be raised in the mother’s group, effectively increasing male versus female migration rates. Moreover, it is likely that, in the highly hierarchized setting of the Namib, most intergroup extramarital unions would involve men from dominant groups and women from peripatetic communities. This hypothesis is indirectly supported by the finding that in NRY-based clusters (but not in mtDNA) pastoralist populations are grouped together with peripatetic communities that share their cultural traits (Figs. S6 and 3b), suggesting that migration of NRY lineages follows a path that is similar to horizontally transmitted cultural features.
Related:
- Post-Neolithic Y-chromosome bottleneck explained by cultural hitchhiking and competition between patrilineal clans
- Haplogroup is not language, but R1b-L23 expansion was associated with Proto-Indo-Europeans
- Lazaridis’ evolutionary history of human populations in Europe
- David Reich on social inequality and Yamna expansion with few Y-DNA subclades
- Tales of Human Migration, Admixture, and Selection in Africa
- Pleistocene North African genomes link Near Eastern and sub-Saharan African human populations
- Genetic ancestry of Hadza and Sandawe peoples reveals ancient population structure in Africa
- R1b-V88 migration through Southern Italy into Green Sahara corridor, and the Afroasiatic connection
- Potential Afroasiatic Urheimat near Lake Megachad