Open access Mobility patterns in inland southwestern Sweden during the Neolithic and Early Bronze Age, by Blank, Sjögren, Knipper, et al. Archaeol. Anthropol. Sci. 13, 64 (2021).
NOTE. For a full archaeological description of the area of study, refer to the related paper Old bones or early graves? Megalithic burial sequences in southern Sweden based on 14C datings, by Blank, Sjögren, & Storå, Archaeol. Anthropol. Sci. 12, 89 (2020).
Interesting excerpts (emphasis mine):
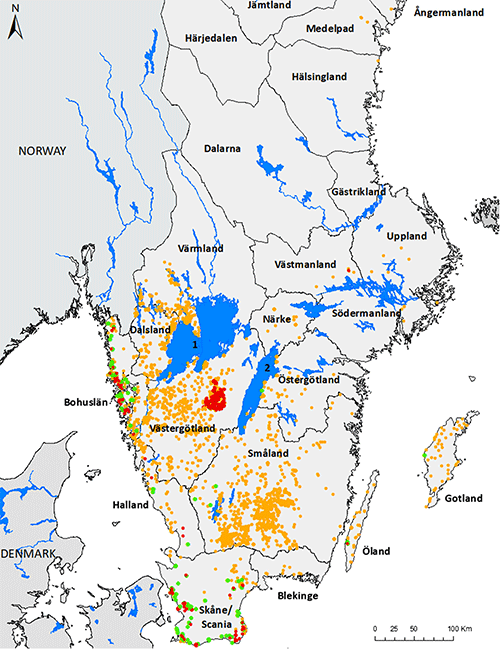
The sampling from megalithic graves shows a chronological gap of at least 400 years (2600–2200 cal BC), when no megalithic graves were constructed or used (Fig. 6, Blank et al. 2020). The absence of human remains from this time span, and the few burials representing 2800–2600 cal BC prevent us from describing a complete picture of the development in the area. Instead, data from the human remains from the two main phases of use are compared.
Strontium isotopes and placement of the dead
Burials from both main periods occur in several passage graves. (…) Among the individuals in the chambers were locals to Falbygden, semi-locals and non-locals. In contrast, seven of eight individuals recovered either from the mound, in the entrance area or in the passage, yielded 87Sr/86Sr ratios within the local range of Falbygden. Due to poor documentation and later disturbances, the exact original positions of the skeletons are rarely known.
The results indicate a tendency for individuals in the peripheral parts of the grave to be local, assuming that the chamber is the primary place for deposition of dead bodies. Thus, it seems like locals occurred both in the inner and outer parts of the constructions, while the non-locals were mainly interred in the chambers. (…)
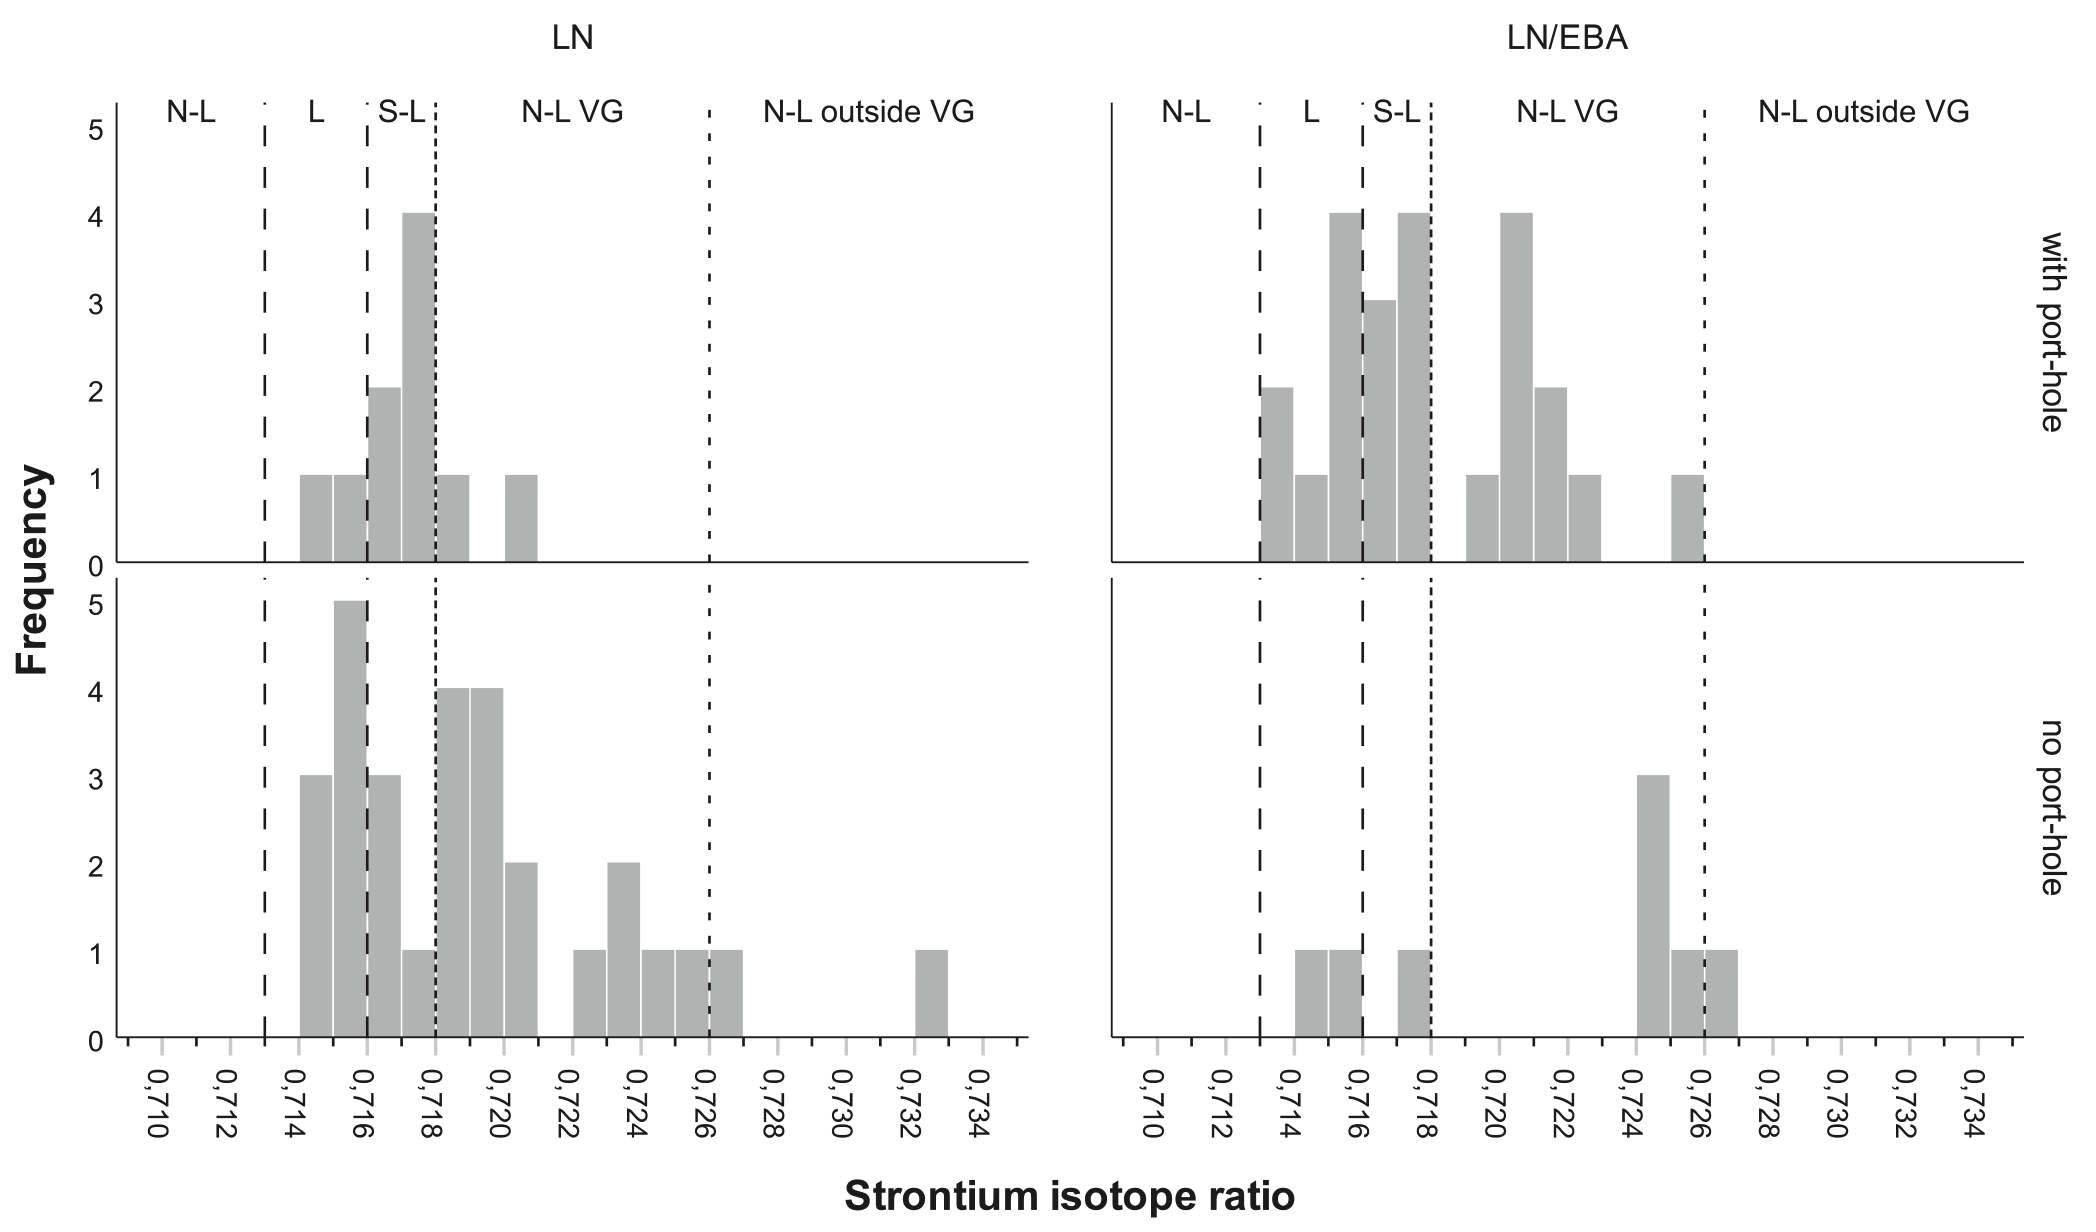
In addition, we compared the Sr isotope ratios from individuals buried in graves with and without port-holes (Fig. 11). In southwestern Sweden, gallery graves with port-holes are common. The emergence and spread of these graves have been extensively discussed (Blank et al. 2020; Ebbesen 2007:62; Janson 1938: 330ff; Kaelas 1967; Montelius 1905) and is still not resolved.
Most of the individuals buried in gallery graves with port-holes are dated to the later part of Late Neolithic-Early Bronze Age, while the earlier phase is dominated by burials in graves without port-holes (Fig. 11), which agrees with the estimated chronology of the two grave types (Blank et al. 2020). Figure 11 shows that no Late Neolithic individuals with Sr isotope ratios over 0.721 occur in the gallery graves with port-holes, whereas burials with 87Sr/86Sr ratios of up to 0.733 form a remarkable portion of the inhumations in gallery graves without a port-hole. During the Late Neolithic/Early Bronze Age, depositions of individuals with ratios between 0.719 and 0.723 were common in graves with port-holes, while such ratios were absent among the burials in the graves without port-holes. In these, the non-local 87Sr/86Sr ratios span from 0.724 to 0.727. In both periods, the frequency of non-locals is higher in the graves without port-holes and non-locals outside VG only appear in the graves without port-holes. The difference in Sr isotope ratios in teeth recovered from graves with and without port-holes is significant in the Late Neolithic, indicating a preference of burying individuals with non-local ratios in gallery graves without port-holes.
Strontium isotopes, geology and location
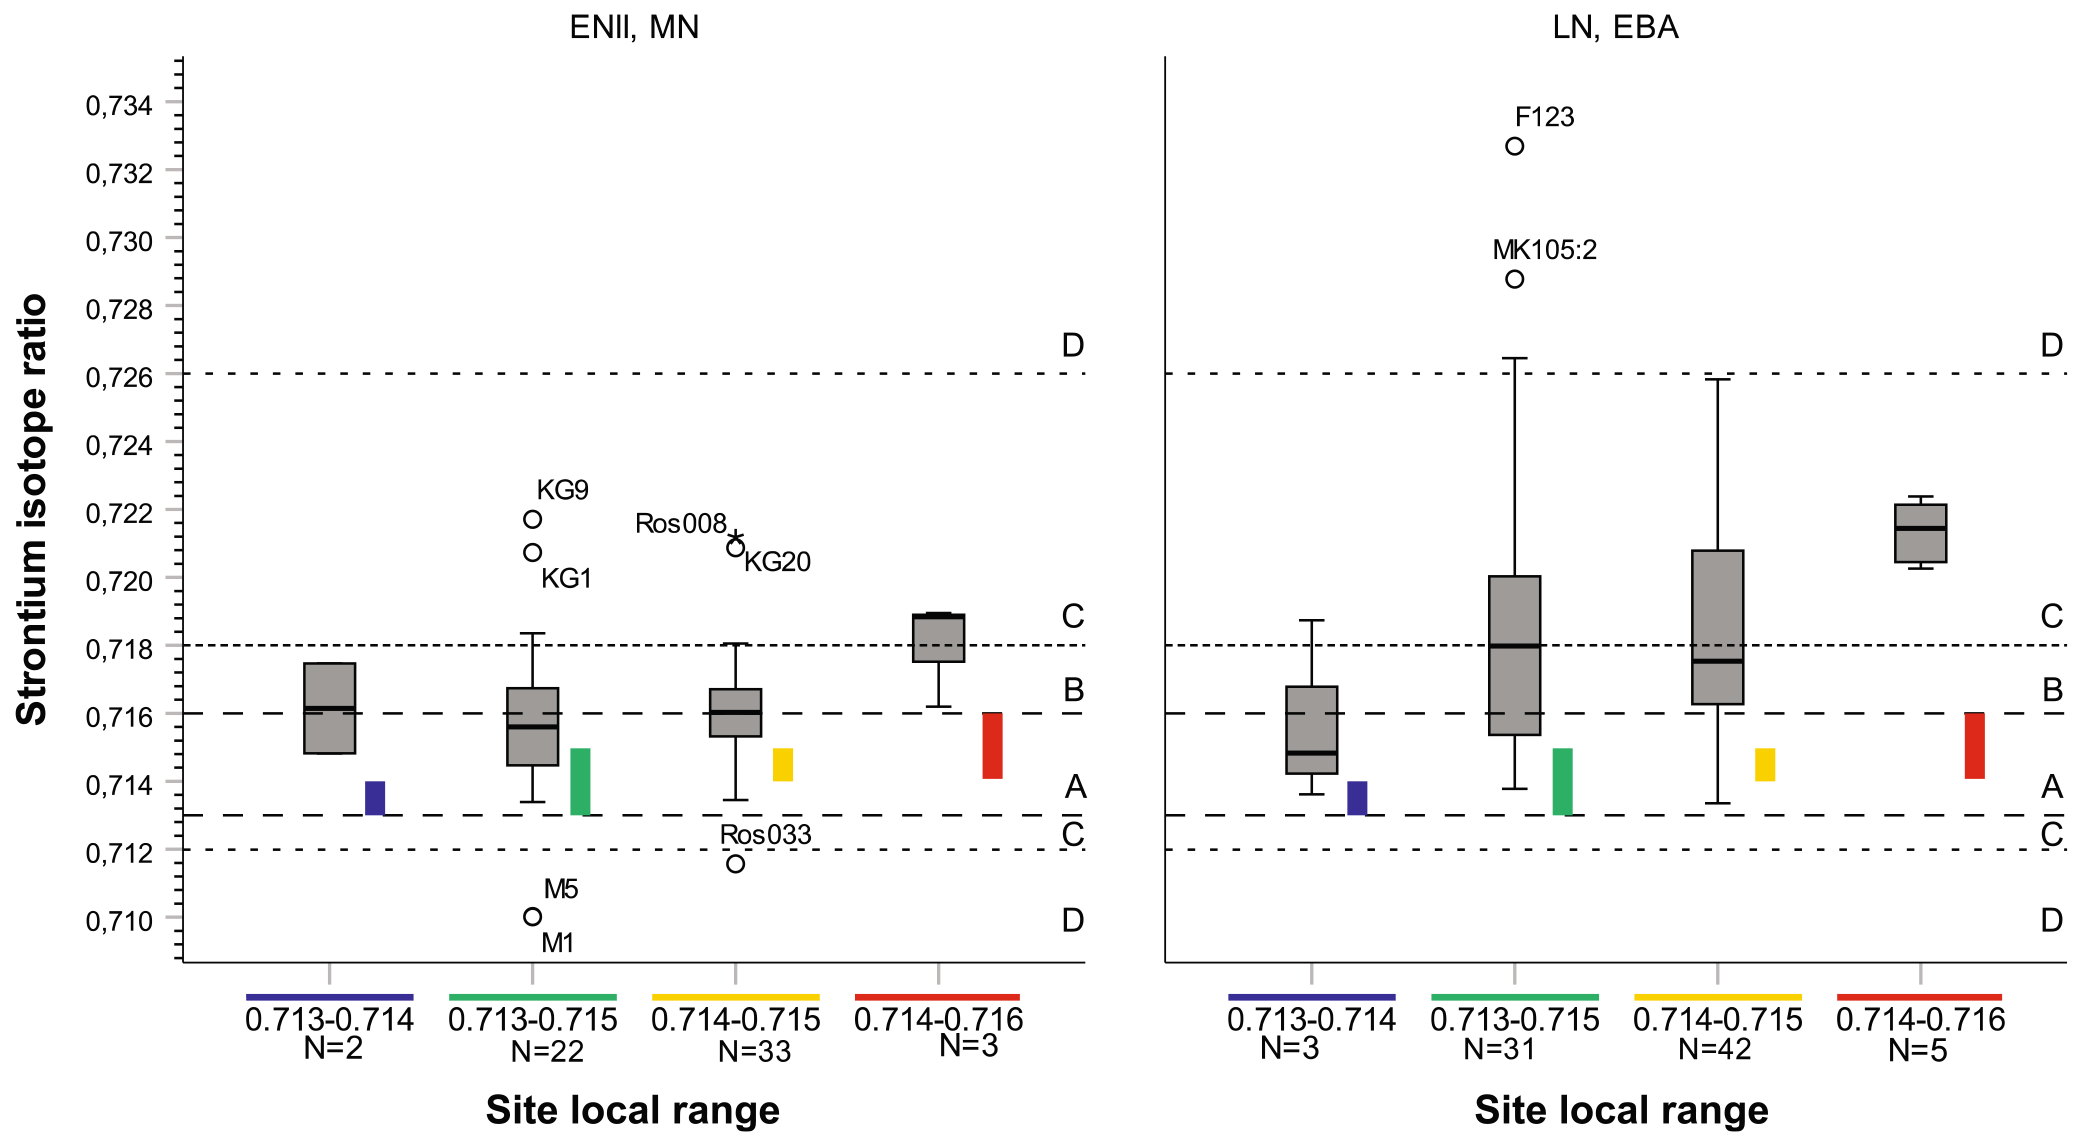
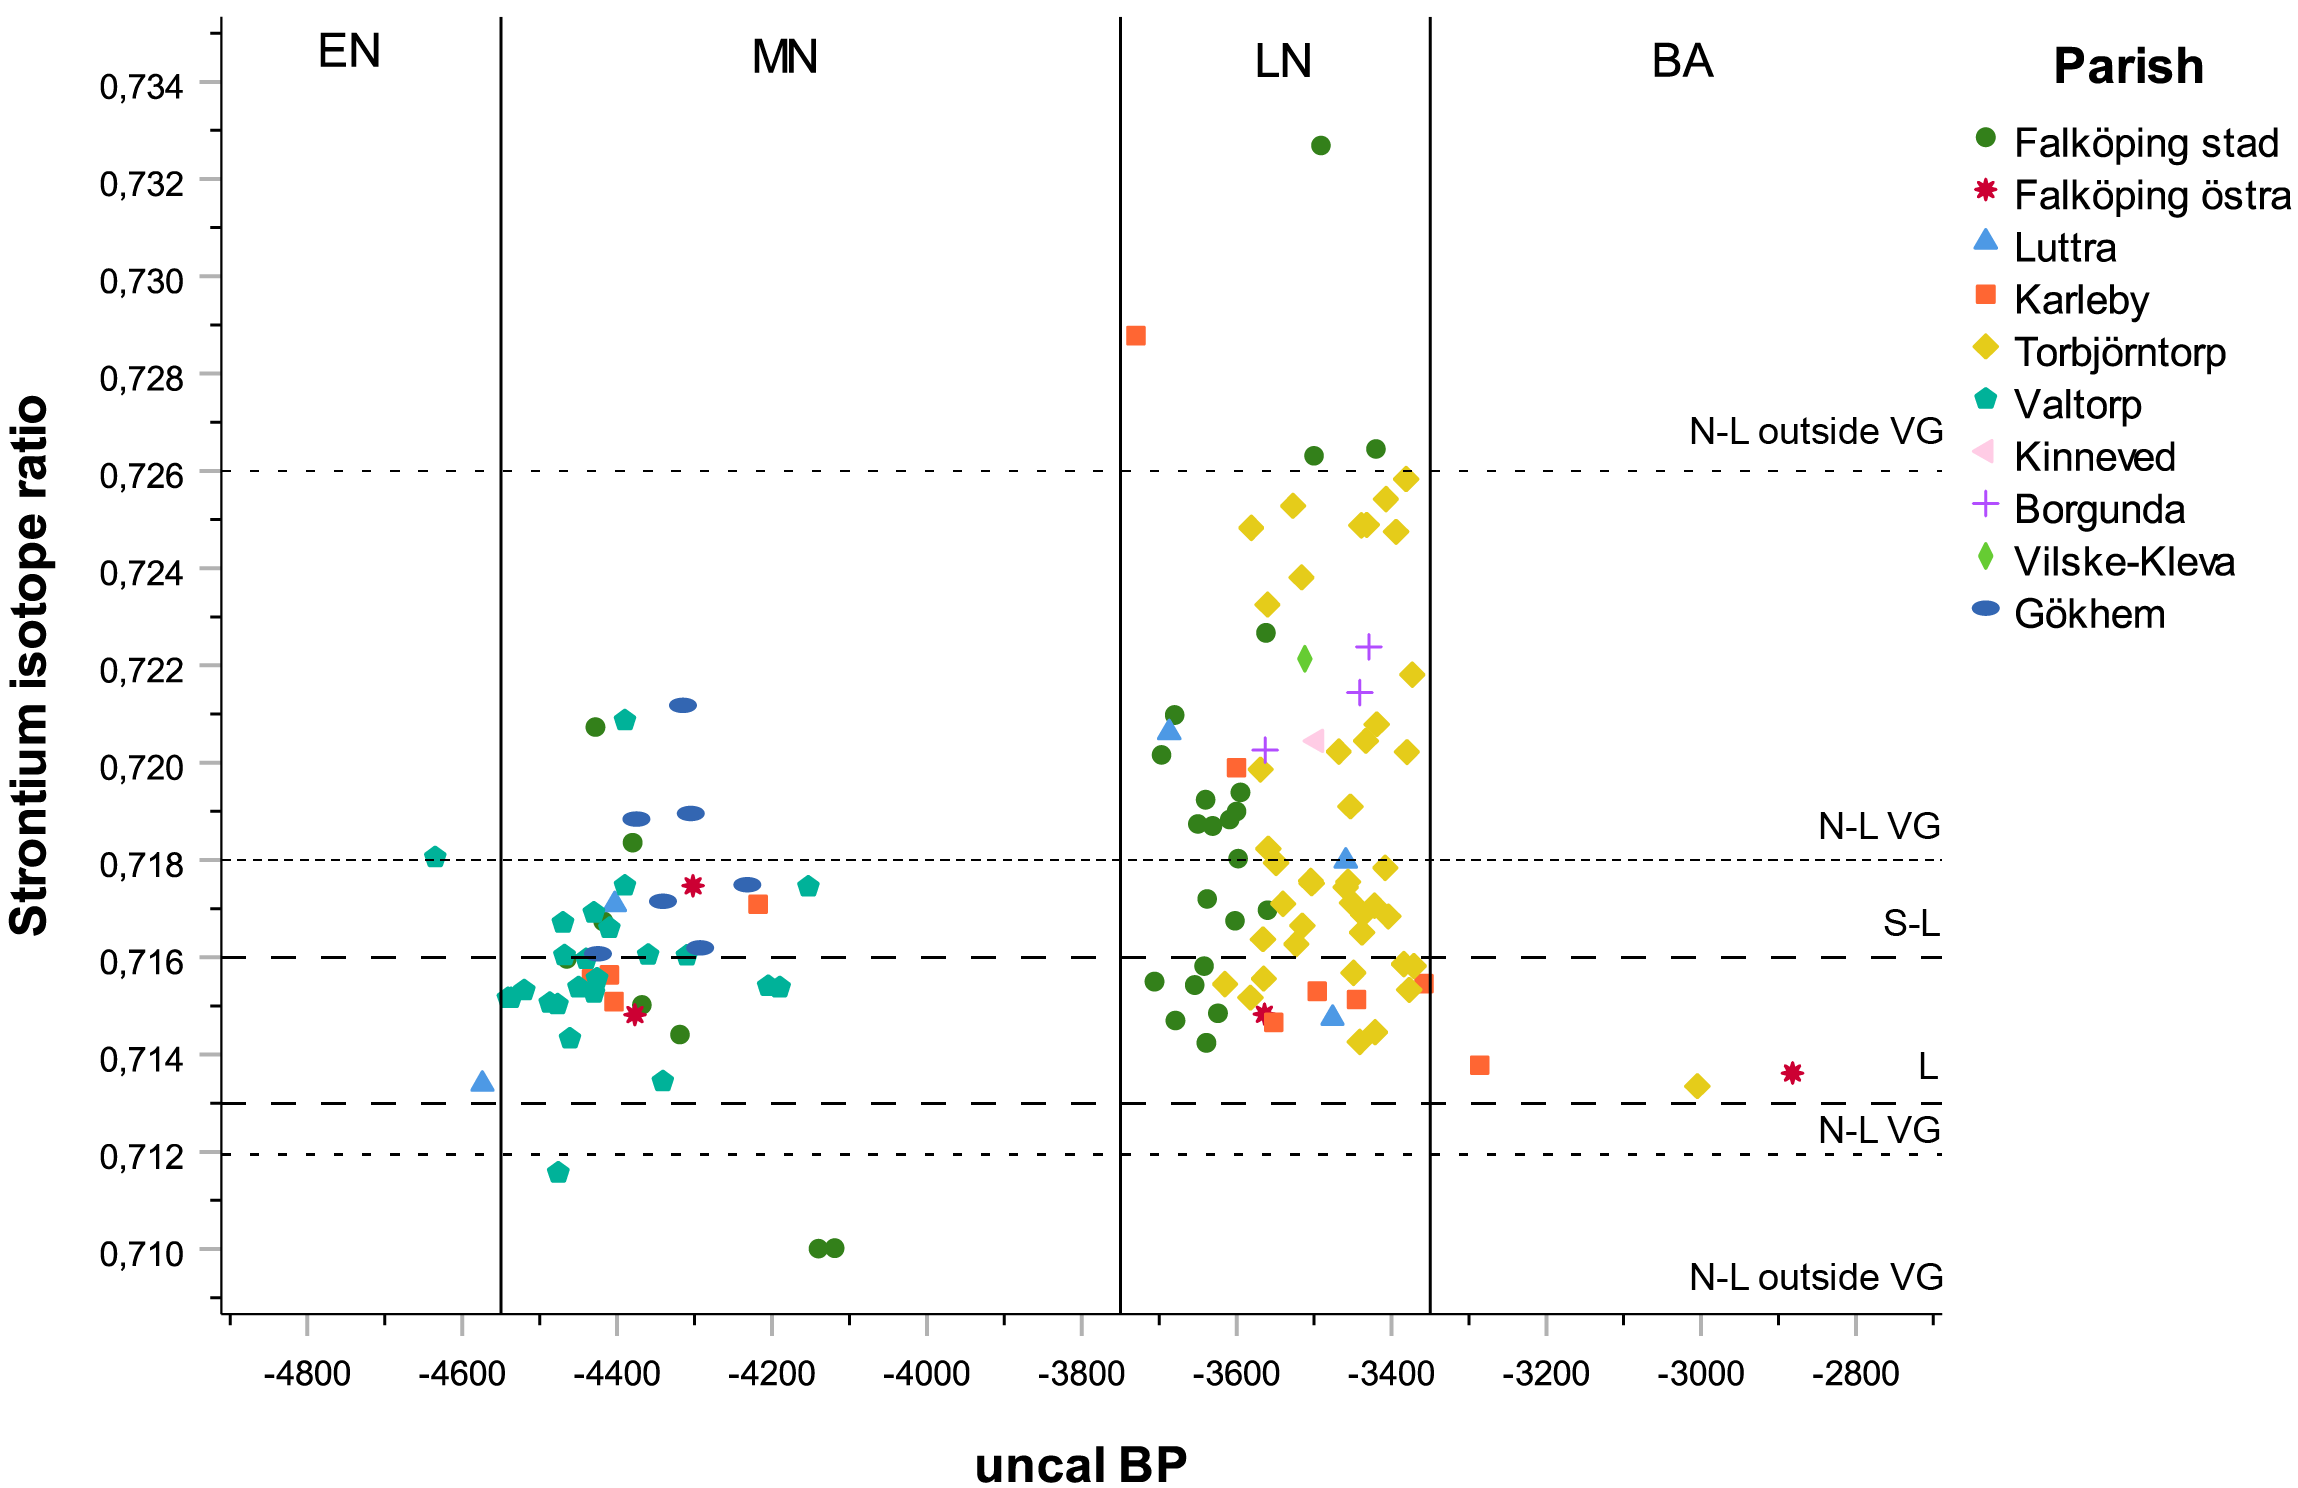
Figure 12 demonstrates that most of the human data are higher than what is found in the immediate surroundings of the sites. A tendency for higher Sr isotope ratios among the buried individuals in areas with higher site local ranges can be discerned. However, the two groups with highest site local ranges only include eight individuals, while the group 0.714–0.715 comprises 75 individuals.
The proportion of humans with a site local ratio is low in both periods (11.7% in Early Neolithic-Middle Neolithic and 11.1% in Late Neolithic-Early Bronze Age, Table A3:2). Assuming that agricultural fields and water sources providing most of the biologically available Sr instead were located in a radius of 5 km around the burial site (1-h walking distance), the proportion of individuals within these ranges are considerably higher in the Early Neolithic-Middle Neolithic (32%), while it remains low in the Late Neolithic-Early Bronze Age (17%).
mtDNA haplogroups
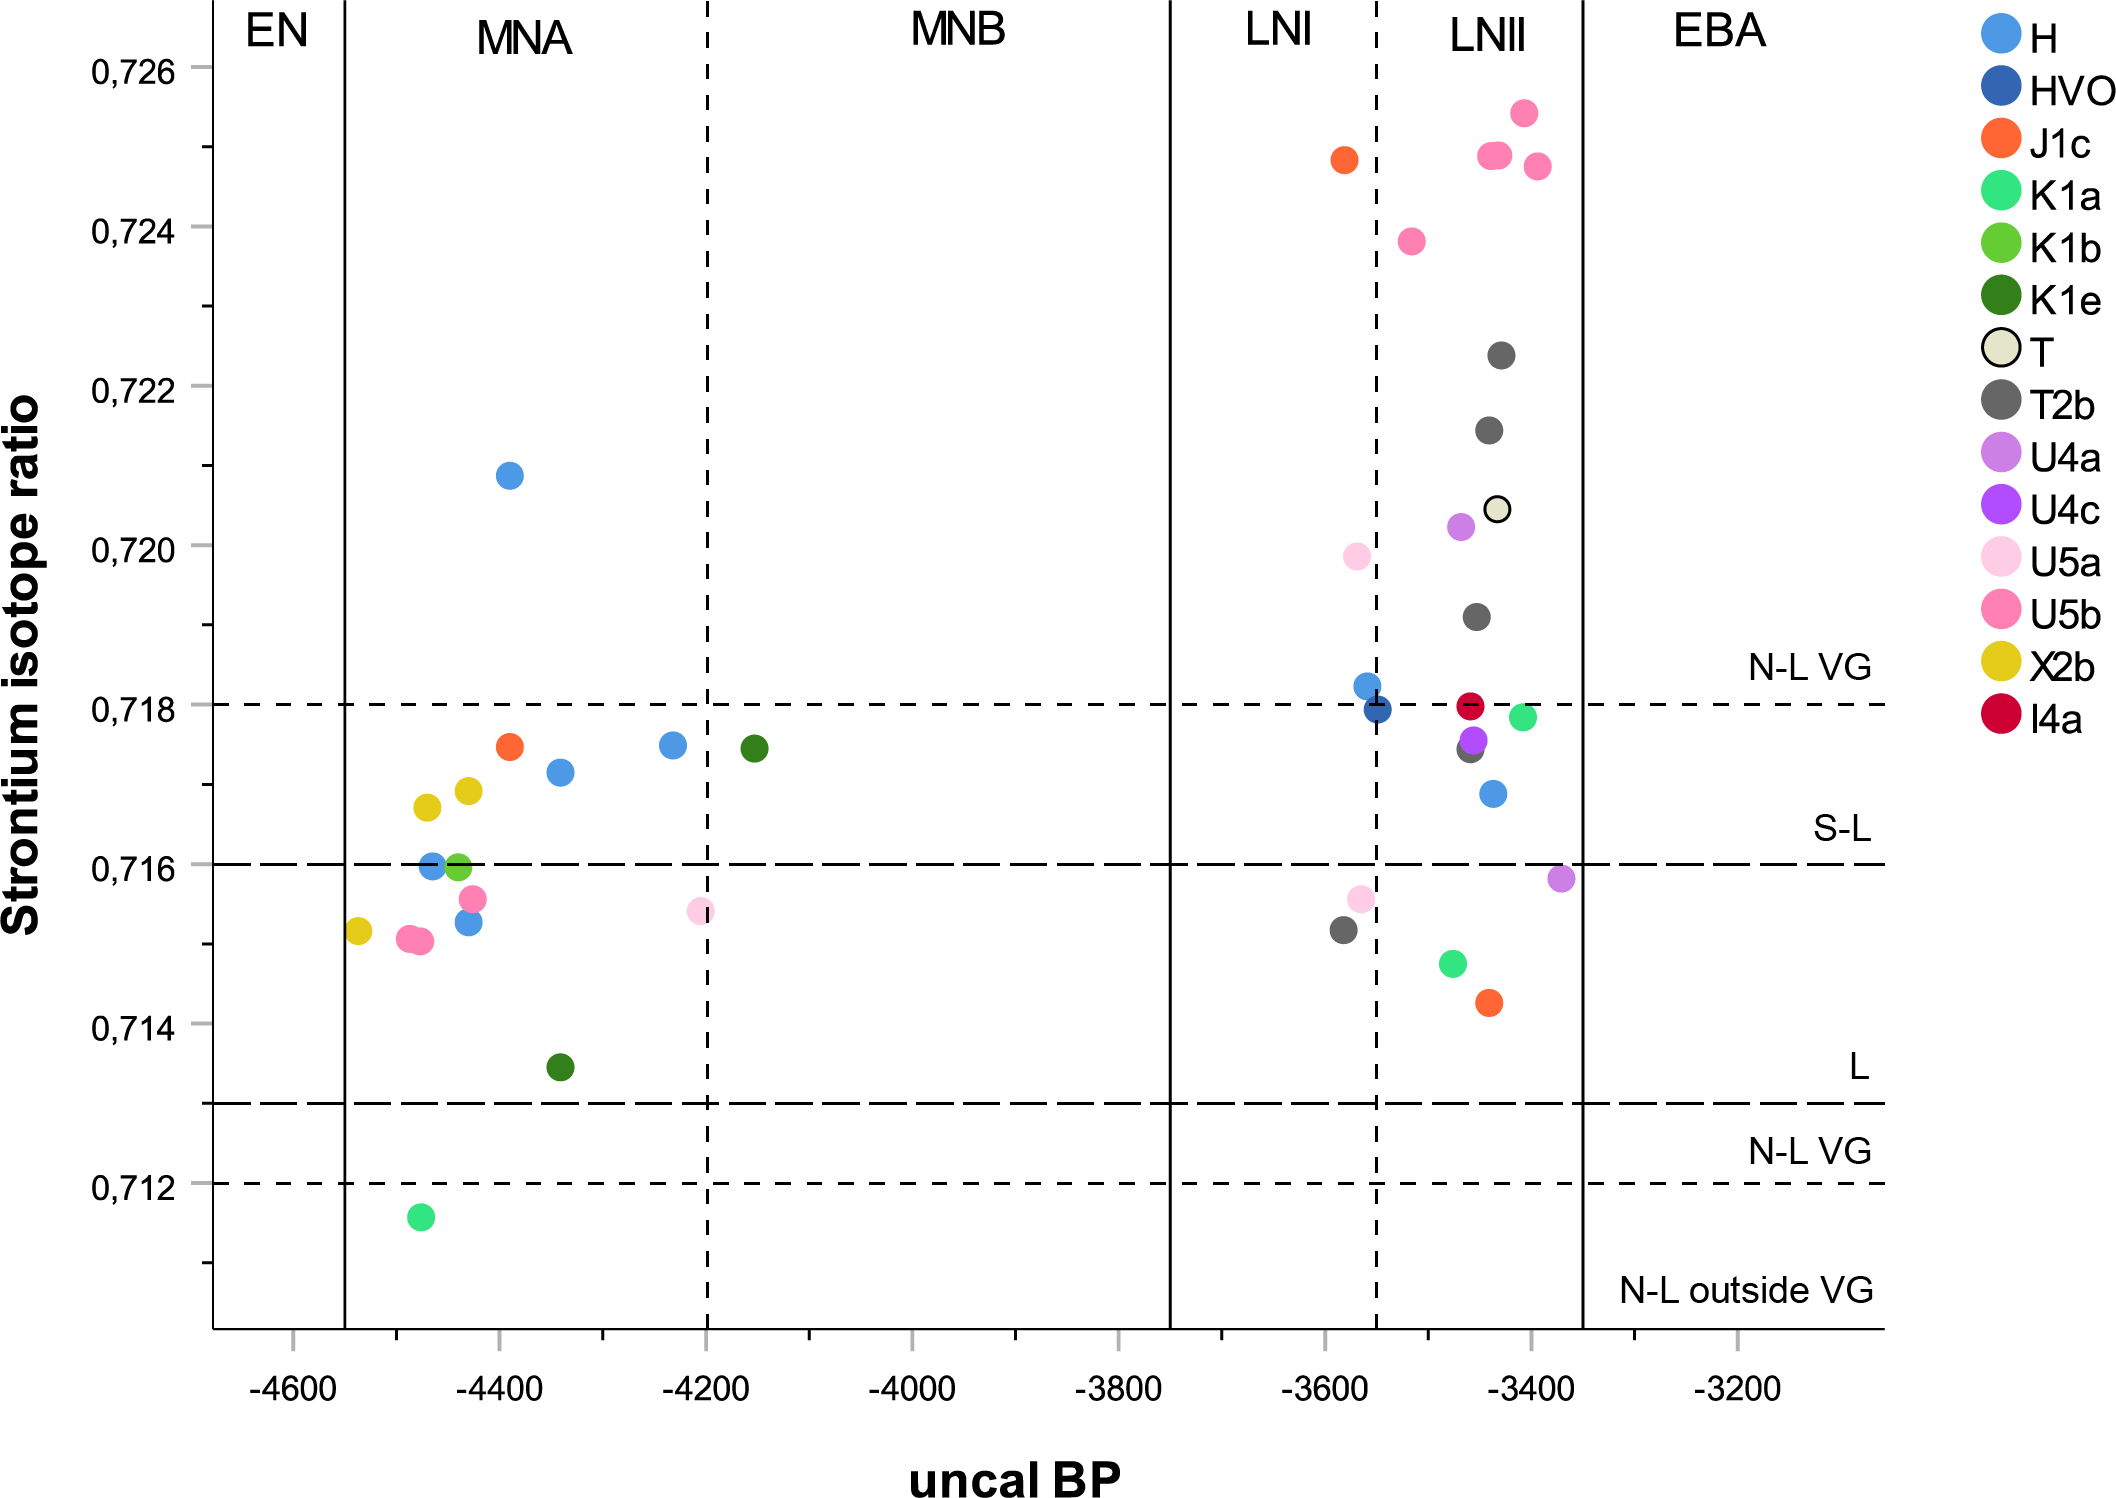
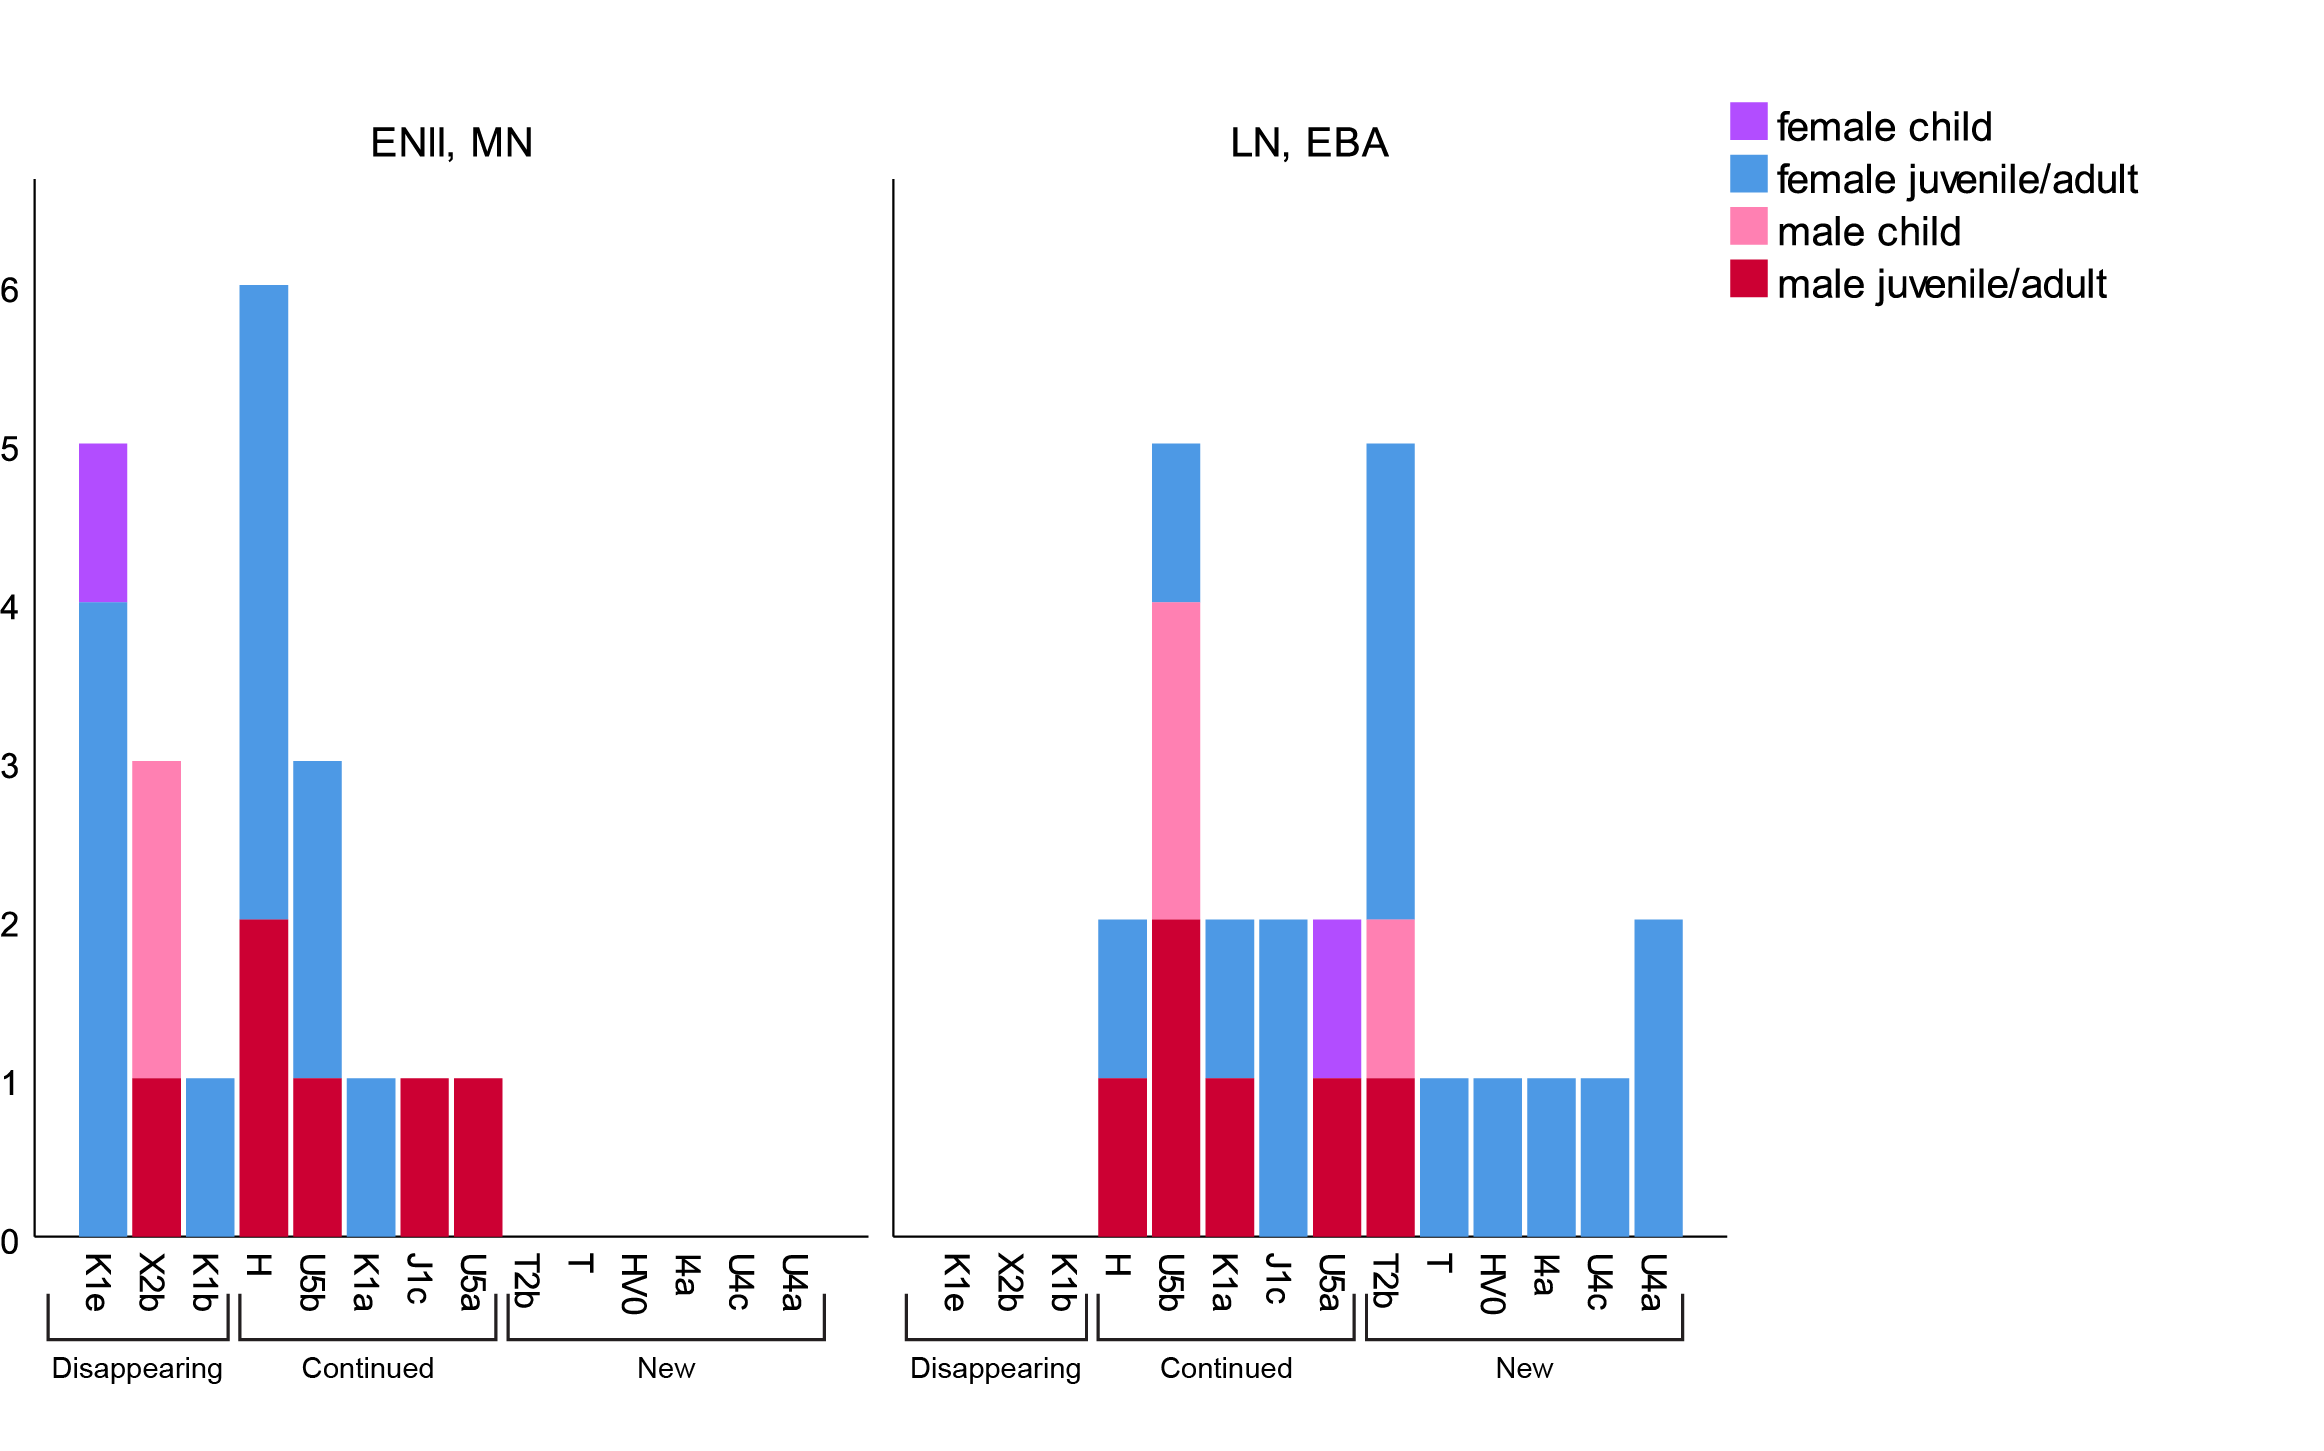
A replacement of haplogroups occurs with the disappearance of some and the appearance of other groups over time. The X2b, K1b and K1e haplogroups are only present among Middle Neolithic individuals, while the HV0, T, U4a, U4c and I4a haplogroups only are identified among Late Neolithic and Late Neolithic/Early Bronze Age individuals. Furthermore, the T, U4a, U4c and I4a only occur in the latest part of the second phase, suggesting an introduction of several new haplogroups in the Late Neolithic II and transition to Early Bronze Age (Fig. A3:8). A continuation of the mtDNA haplogroups H, U5b, K1a, J1c, U5a, and T2b was also observed.
Considering the sex assessments of the individuals, there seems to be a greater variation of haplogroups among the females dated to the Late Neolithic-Early Bronze Age (Fig. A3:9). Furthermore, all but one of the new haplogroups appearing in the Late Neolithic-Early Bronze Age were found exclusively among females. However, these groups are only represented by few or single individuals (Fig. A3:9).
There seems to be a greater variation of mtDNA haplogroups in the Late Neolithic and Early Bronze Age (11 groups) than in the earlier periods (9 groups).
Discussion
Unfortunately, only three individuals were dated to the Middle Neolithic B, and two of them exhibited Sr isotope ratios indicating migrations from more southern regions such as Scania or Denmark. Then, there is a gap of at least 400 years when the megalithic graves were not used for burials, and no other skeletal remains are available. This period is represented by the BAC and overlaps with the above-mentioned burials. In Falbygden, the presence of the BAC is mainly recognized by finds of battle axes, flint axes and pottery. Thus, we cannot say anything about the mobility in Falbygden during this time, but according to aDNA studies previously mentioned, these people originated from CW groups that moved to southern Scandinavia from continental Europe.
In the Late Neolithic, people became more mobile, especially from the transition between Late Neolithic I and II, and people seem to have moved in groups to a greater extent including females, males and children.. During the Late Neolithic-Early Bronze Age, the non-locals mainly represented children and adults, suggesting that both these categories migrated into Falbygden, potentially partly consisting of family groups. Humans moved over larger areas than in the previous period, and individuals from new locations to the east/northeast migrated into Falbygden.
In Late Neolithic II-Early Bronze Age, the difference in Sr isotope ratios between sexes was significant, unlike in earlier periods where this correlation was not present. Clusters of females and males with similar Sr isotope ratios were observed. In Falbygden, the greater variation of 87Sr/86Sr isotope ratios, mtDNA haplogroups, δ15N and the greater variation of megalithic grave constructions in the Late Neolithic-Early Bronze Age, compared to the Early Neolithic-Middle Neolithic, point to a more heterogeneous society that could be described as a melting pot of different groups from various locations. The growing mobility in the Late Neolithic was mainly connected to movements between Falbygden and locations outside of the sedimentary area. Growing long-distance exchange networks and migrations of families establishing in Falbygden, where climate changes and population pressure might have been possible triggers, could explain these movements.
A peak of non-local Sr ratios and of variability in Sr isotope ratios and mtDNA haplogroups occur in the Late Neolithic II. At the same time, cooling temperatures and increasing precipitation occur in western Sweden. Thus, we propose a distinct change in mobility at the onset of Late Neolithic II potentially connected to a climate change, a shift in economic and social structures and an expansion of exchange networks and to a generally increased population. The exchange networks, from ca 2000 cal BC, may partly have been maintained by marriage alliances.
Wrap-Up
It is unclear what aDNA paper they are referring to in the discussion (if Allentoft et al. 2015 or Malmström et al. 2019) when suggesting that BAC represents an intrusion of non-locals from the south, but this assessment is probably based mainly on the increasing TRB-like ancestry found among (late) BAC samples from Southern Sweden.
However, this ancestry merely represents an admixture with locals, and Y-chromosome bottlenecks (and archaeology, mind you) suggest that BAC groups actually migrated from the SE Baltic through SW Finland, based on the initial spread of the Battle Axe culture predominantly with hg. R-Y2395 from the SE Baltic up to Scania, and the different haplogroups from CWC Denmark found spreading with Central European Corded Ware.
The most interesting aspect of the paper, given the lack of information from this area regarding the expected influence of Bell Beaker-related peoples (or pushed Danish CWC-related non-locals), is the migration of whole families and likely increasing marriage alliances with female exogamy from the East during the EBA. This supports the suggested “Balto-Finnic” substrate of Proto-Germanic, based on the assumed Proto-Germanic homeland in Southern Scandinavia, and is a good model for later alliances with Akozino warrior-traders, marked by the appearance of hg. N-VL29 throughout the Baltic.
Maybe it is too soon to tell, but from the first look at this and the other recently published paper on detailed isotope assessments from Denmark (later complemented with aDNA), there does not seem to be any definitive information even about the potential range of geographical origin for non-locals, a problem also observed for Tollense warriors. The variability in methods used and lack of clear-cut thresholds makes this discipline prone to many different ad hoc interpretations.
Of course, these studies might be great to understand fine-scale population movements at a local level, and maybe they will reveal themselves as a great tool for archaeologists focused on local and supralocal developments. Also, it is a great way to incorporate archaeologists into multidisciplinary teams with geneticists. After all, not every paper on population genomics has to be made of hundreds of aDNA samples with overarching (and usually far-fetched, simplistic) interpretations published in Nature or Science.
On the other hand, it seems to be lacking in what many European archaeologists need right now: a clear-cut quantitative method to dismiss the prevalent nativist and continuist ideas about “their” regional cultures. So, I cannot help but wonder if 10M € of EU money dedicated to this would not be better spent supporting DNA analyses instead, including better coverage samples from worse studied periods and areas, if the final aim is really to get a better picture of prehistoric population movements.
Related
- The Last of the Single Gravers
- Recent Yamnaya-related intrusion in a Denmark Late Neolithic burial
- Predictions about the genetic change from Single Grave to the Late Neolithic in Denmark
- Proto-Indo-European kinship system and patrilineality
- The complexities of 3rd millennium Steppe-related migrations
- Yamnaya ancestry: mapping the Proto-Indo-European expansions
- European hydrotoponymy (III): from Old European to Palaeo-Germanic and the Nordwestblock
- Pre-Germanic and Pre-Balto-Finnic shared vocabulary from Pitted Ware seal hunters
- European hydrotoponymy (I): Old European substrate and its relative chronology
- European hydrotoponymy (II): Basques, Iberians, and Etruscans after Old Europeans
- Pre-Germanic and Pre-Balto-Finnic shared vocabulary from Pitted Ware seal hunters
- Bell Beaker/early Late Neolithic (NOT Corded Ware/Battle Axe) identified as forming the Pre-Germanic community in Scandinavia
- Minimal Corded Ware culture impact in Scandinavia – Bell Beakers the unifying maritime elite
- Pre-Germanic born out of a Proto-Finnic substrate in Scandinavia
- Kortlandt: West Indo-Europeans along the Danube, Germanic and Balto-Slavic share a Corded Ware substrate
- Reproductive success among ancient Icelanders stratified by ancestry
- Genomic analysis of Germanic tribes from Bavaria show North-Central European ancestry
- Germanic tribes during the Barbarian migrations show mainly R1b, also I lineages
- On Proto-Finnic language guesstimates, and its western homeland