Interesting new article (behind paywall), The demographic history and mutational load of African hunter-gatherers and farmers, Nat Ecol Evol (2018)
Abstract (emphasis mine):
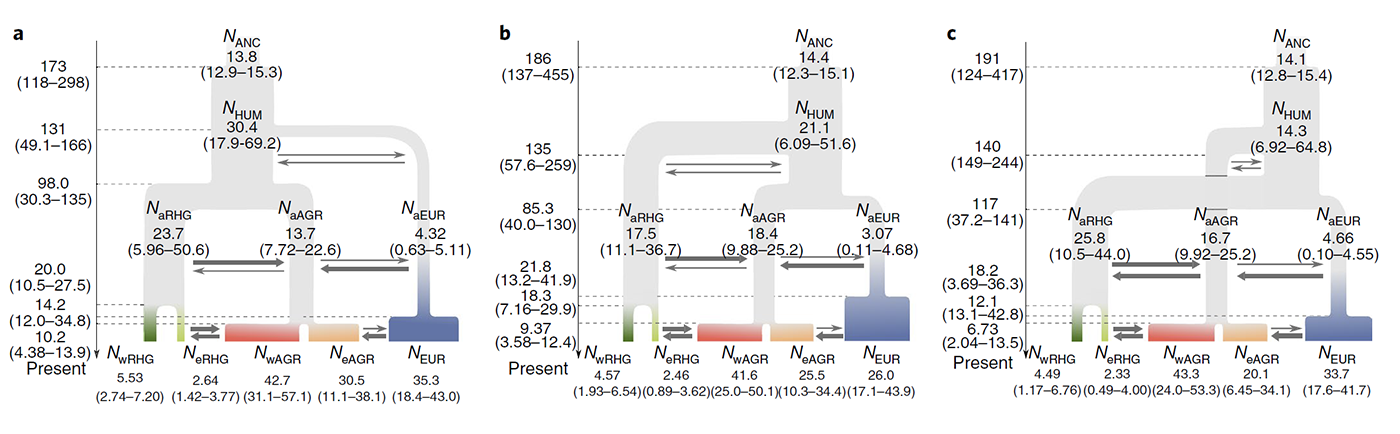
Understanding how deleterious genetic variation is distributed across human populations is of key importance in evolutionary biology and medical genetics. However, the impact of population size changes and gene flow on the corresponding mutational load remains a controversial topic. Here, we report high-coverage exomes from 300 rainforest hunter-gatherers and farmers of central Africa, whose distinct subsistence strategies are expected to have impacted their demographic pasts. Detailed demographic inference indicates that hunter-gatherers and farmers recently experienced population collapses and expansions, respectively, accompanied by increased gene flow. We show that the distribution of deleterious alleles across these populations is compatible with a similar efficacy of selection to remove deleterious variants with additive effects, and predict with simulations that their present-day additive mutation load is almost identical. For recessive mutations, although an increased load is predicted for hunter-gatherers, this increase has probably been partially counteracted by strong gene flow from expanding farmers. Collectively, our predicted and empirical observations suggest that the impact of the recent population decline of African hunter-gatherers on their mutation load has been modest and more restrained than would be expected under a fully recessive model of dominance.
See also:
- Signal of recent positive selection for African ancestry in the admixed population of Madagascar
- R1b-V88 migration through Southern Italy into Green Sahara corridor, and the Afroasiatic connection
- Earliest modern humans outside Africa and ancient genomic history
- Review article about Ancient Genomics, by Pontus Skoglund and Iain Mathieson
- Review article on the origin of modern humans: the multiple-dispersal model and Late Pleistocene Asia
- Genetic landscapes showing human genetic diversity aligning with geography