I mentioned in the Indo-European demic diffusion model the need to assess absolute and relative population growth – as well as other demographic changes – to interpret genomic data from the different European regions studied.
One article I referred to was Demographic traces of technological innovation, social change and mobility: from 1 to 8 million Europeans (6000–2000 BCE), by Johannes Müller.
Excerpts (emphasis mine):
- The neolithization of Northern and Northwestern Europe (probably with new forms of slash-and-burn agriculture; Feeser et al. 2012; Schier 2009) was also one of the causes for the population increase observed.
- The introduction of the plough and developing technologies (e.g. the introduction of the wheel) (cf. Mischka 2011) might also be causes of rising population figures from ca. 3500–3000 BC.
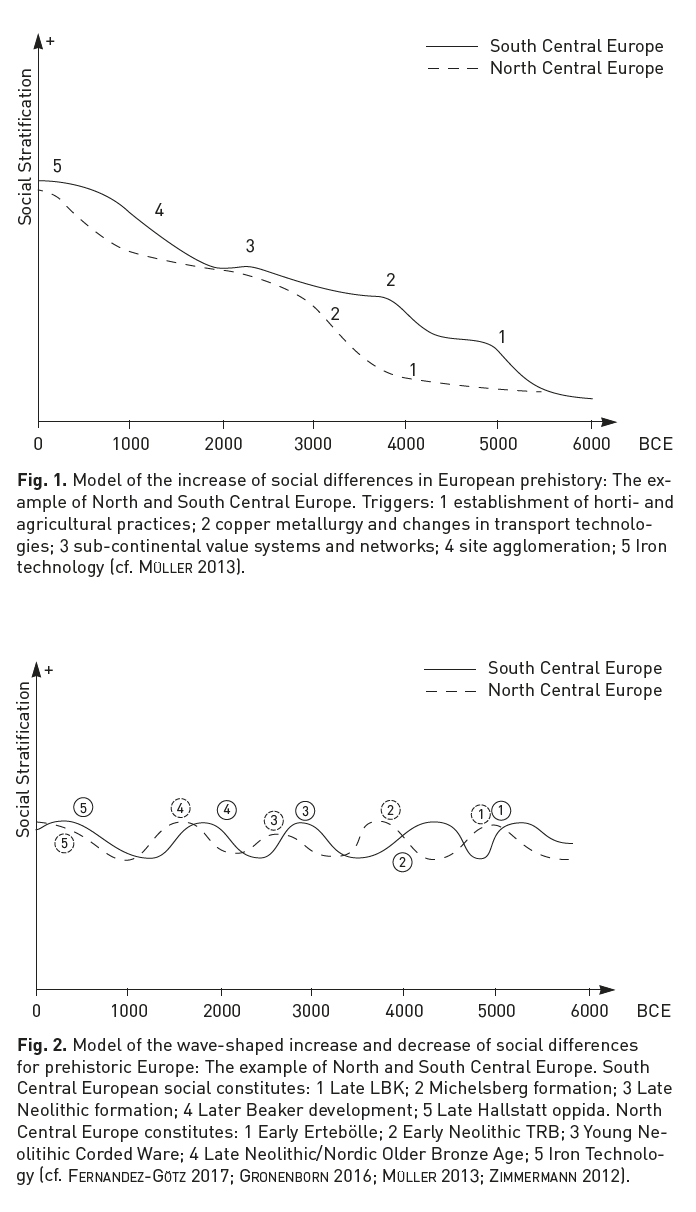
- The establishment of subcontinental value systems, such as the Corded Ware and Bell-Beaker phenomena (Czebreszuk/Szmyt 2003; Furholt 2004), in contrast to regional identities, might have triggered different reactions in different areas, leading to fluctuating population levels.
- The introduction of Bronze Age ideologies, including bronze as a technology, triggered the spread of Neolithic and Bronze Age societies to vast areas of Europe (e.g. Earle/Kristiansen 2010).A major population increase is observed in both the areas already settled as well as in new areas of interest.
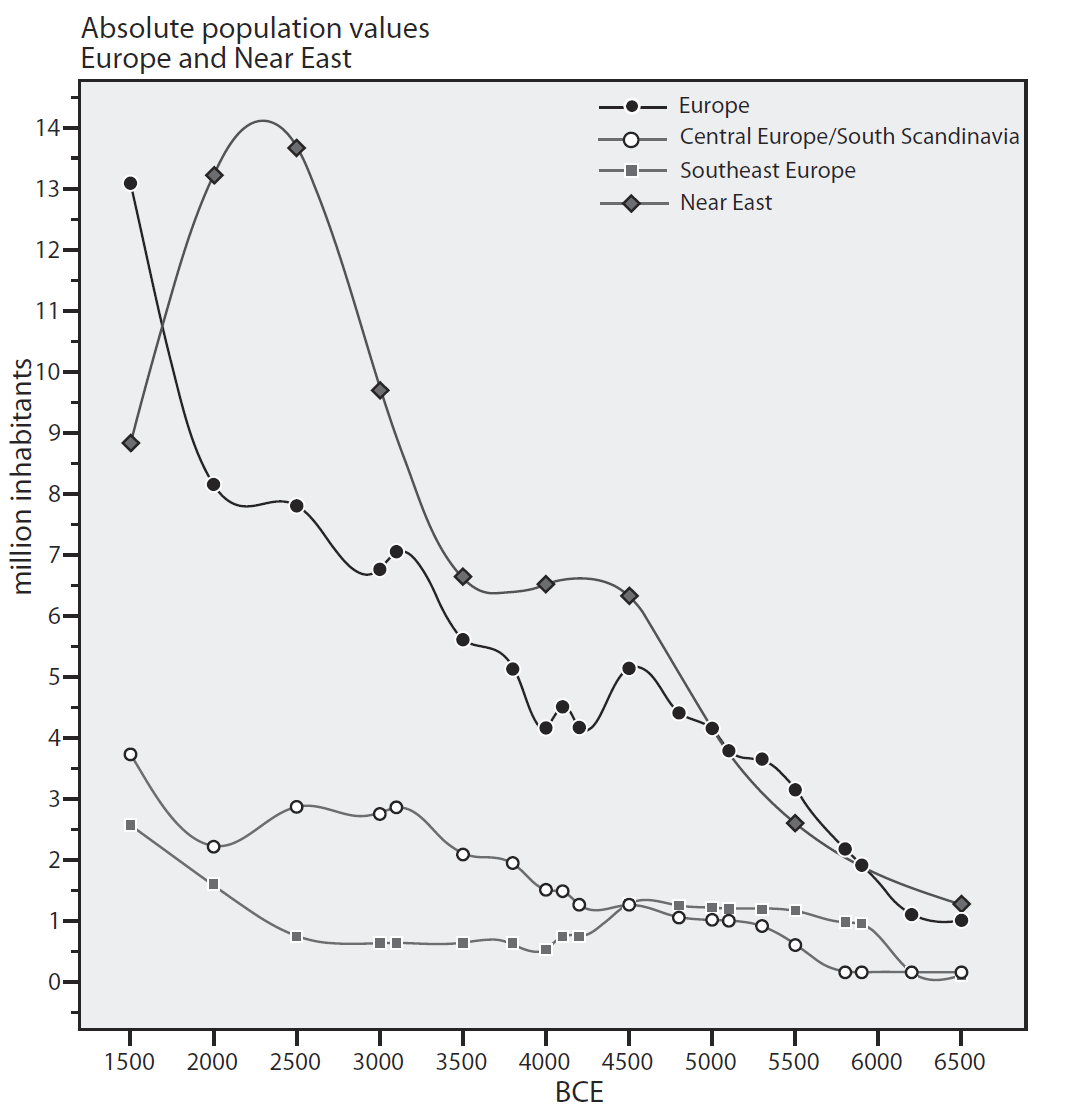
In our population estimations for Central Europe and Scandinavia, population increases are associated with the periods from 5500–5000 BCE (LBK) and 3500–3000 BCE (middle and late Funnelbeaker Culture), but not for the period from 2500–2000 BCE (Bell Beaker). Consequently, this would possibly indicate forms of immigration for the first two periods and a form of interregional networking (e.g. through marriage) for the latter. But as also for the first cases on the supra-regional level (which our enquiries investigated), no other area with a significant population decrease could be observed, therefore “proof” for larger population displacement is not given. For such inquiries, studies on a more regional level are probably necessary. Nevertheless, for the Bell Beaker period I would like to exclude the possibility of large population influxes at least to Central Europe and South Scandinavia as the population values show no indication of such an event (cf. Fig. 10). In consequence, supra-regional networks or population-exchanges between smaller regions might be responsible for the isotope values.
One could interpret from the graphics, including known anthropological and genomic data, that:
- The population growth corresponding to the Corded Ware expansion from ca. 3300 into Central Europe was seen initially with the introduction of new technology, but then stalled – probably with population replacement during the A-horizon of the Corded Ware culture.
- The Yamna expansion into South-East Europe must have included some population replacement, i.e. influx into progressively deserted areas (such as that of the Cucuteni-Trypillia culture), since it did not leave traces of population growth.
- The impact of the expansion of East Bell Beakers from ca. 2500 BC is clear in South-East Europe, and especially in Western Europe – taking into account the whole population growth in Europe. In Central Europe and Scandinavia the overall impact of BB migration was more limited, which suggests some degree of population replacement.
Also important to interpret genomic data are the actual economic and social differences in the different periods and cultures – usually growing after the introduction of farming. A good example is the scarce data from Khvalynsk, where the sample of haplogroup R1b (most likely of subclade M269) shows – apart from a closer position in PCA to Yamna – a a high-status burial, similar to high-status individuals buried under kurgans in later Yamna graves. This man was therefore probably a founder of an elite group of patrilineally-related families, which dominated in the following Yamna culture, which explains the clear expansion of this haplogroup’s subclades from this region.
Other interesting papers on European demographics by Johannes Müller include:
- J. Müller, 8 Million Neolithic Europeans: Social Demography and Social Archaeology on the Scope of Change – from the Near East to Scandinavia, In: Kristiansen, Smejda and Turek (eds.) Paradigm Change (Oxbow; Oxford, 2015) 200-14.
- J. Müller, From the Neolithic to the Iron Age – Demography and Social Agglomeration: The Development of Centralized Control? In: D. K. M. Fernandez-Götz (eds.), Individualization, Urbanization and Social Differentiation: Eurasia at the Dawn of History (Cambridge 2016) 106-124.
Check out also works by Marko Porčić (such as Radiocarbon test for demographic events in written and oral history) or Stephen Shennan.
EDIT (17 Feb 2018): For how variation in the effective population size governs genetic diversity, see:
- Determinants of genetic diversity, by Hans Ellegren & Nicolas Galtier, Nature Reviews Genetics (2016) 17:422–433.
- Revisiting an Old Riddle: What Determines Genetic Diversity Levels within Species?, by Ellen M. Leffler , Kevin Bullaughey , Daniel R. Matute, et al., PLOS Biology (2012)
Featured image, from the main article: “The distribution of agrarian regions in Europe and the Near East in relation to the supra-regions as defined in this study: Near East (NE) about 2.400.000 km2; South East Europe (SEE) about 1.087500 km2; Central Europe and South Scandinavia (CE/SSc) about 1.613.000 km2. Europe includes 10.050.000 km2 (without Iceland)”.
See also:
- The Indo-European demic diffusion model, and the “R1b – Indo-European” association
- The concept of “Outlier” in Human Ancestry (III): Late Neolithic samples from the Baltic region and origins of the Corded Ware culture
- The myth of mixed language, the concepts of culture core and package, and the invention of ‘Steppe folk’
- Science and Archaeology (Humanities): collaboration or confrontation?
- Massive Migrations? The Impact of Recent aDNA Studies on our View of Third Millennium Europe
- The new “Indo-European Corded Ware Theory” of David Anthony
- Bell Beaker/early Late Neolithic (NOT Corded Ware/Battle Axe) identified as forming the Pre-Germanic community in Scandinavia