The paper Quantitative analysis of population-scale family trees with millions of relatives, by Kaplanis, Gordon, Shor, et al. Science (2018) 359(6379), based on a study of genealogical information at Geni, is today news worldwide.
Abstract:
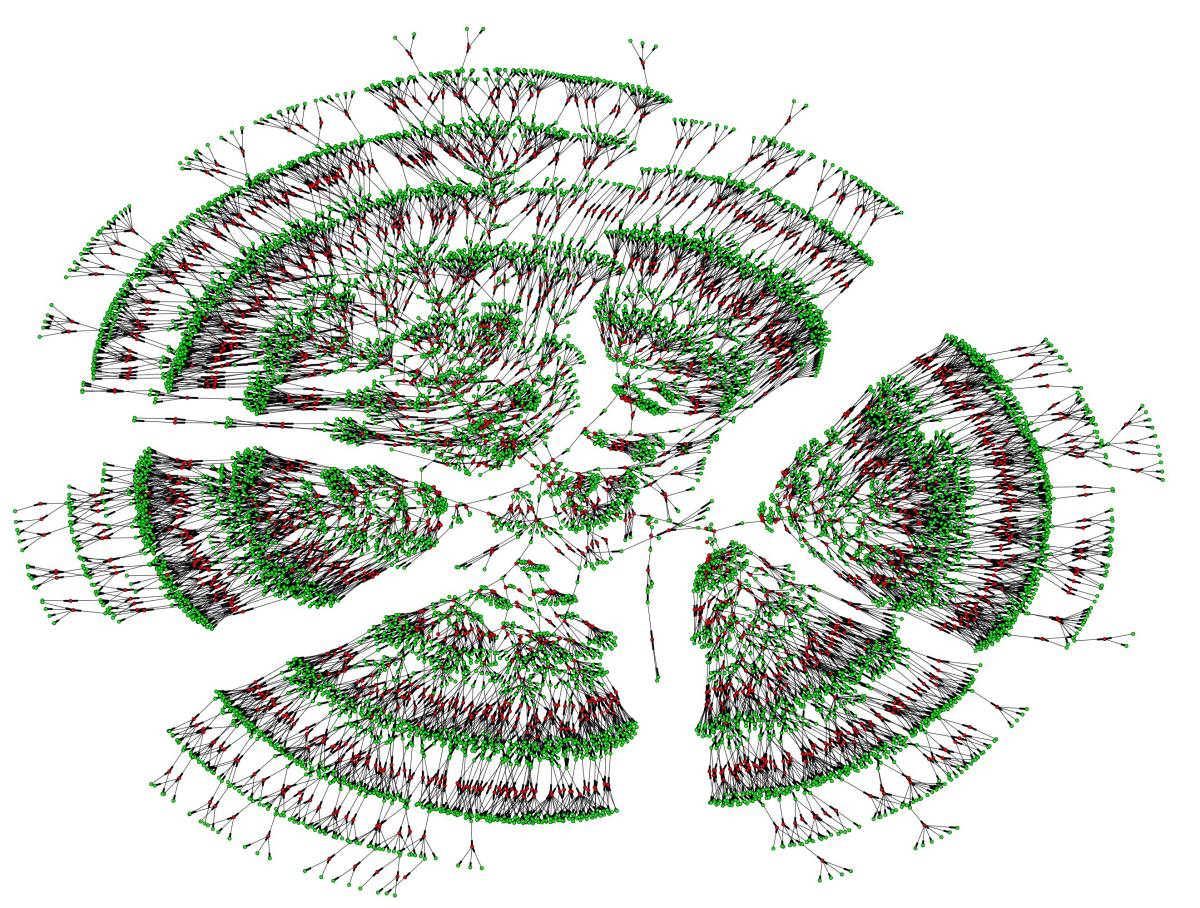
Family trees have vast applications in multiple fields from genetics to anthropology and economics. However, the collection of extended family trees is tedious and usually relies on resources with limited geographical scope and complex data usage restrictions. Here, we collected 86 million profiles from publicly-available online data shared by genealogy enthusiasts. After extensive cleaning and validation, we obtained population-scale family trees, including a single pedigree of 13 million individuals. We leveraged the data to partition the genetic architecture of longevity by inspecting millions of relative pairs and to provide insights into the geographical dispersion of families. We also report a simple digital procedure to overlay other datasets with our resource in order to empower studies with population-scale genealogical data.
While the article is behind a paywall, you can still read its preprint at bioRxiv.
Excerpts interesting for genetic genealogy(emphasis mine):
Assessment of theories of familial dispersion
Familial dispersion is a major driving force of various genetic, economical, and demographic processes (…)
First, we analyzed sex-specific migration patterns (21) to resolve conflicting results regarding sex bias in human migration (52). Our results indicate that females migrate more than males in Western societies but over shorter distances. The median mother-child distances were significantly larger (Wilcox, one-tailed, p < 10−90) by a factor of 1.6x than father-child distances (Fig. 4A). This trend appeared throughout the 300 years of our analysis window, including in the most recent birth cohort, and was observed both in North American (Wilcox, one-tailed, p < 10−23) and European duos (Wilcox, one-tailed, p < 10−87). On the other hand, we found that the average mother-child distances (fig. S17) were significantly shorter than the father-child distances (t-test, p < 10−90), suggesting that long-range migration events are biased toward males. Consistent with this pattern, fathers displayed a significantly (p < 10−83) higher frequency than mothers to be born in a different country than their offspring (Fig. 4B). Again, this pattern was evident when restricting the data to North American or European duos. Taken together, males and females in Western societies show different migration distributions in which patrilocality occurs only in relatively local migration events and large-scale events that usually involve a change of country are more common in males than females.
Next, we inspected the marital radius (the distance be-tween mates’ places of birth) and its effect on the genetic relatedness of couples (21). The isolation by distance theory of Malécot predicts that increases in the marital radius should exponentially decrease the genetic relatedness of individuals (53). But the magnitude of these forces is also a function of factors such as taboos against cousin marriages (54).
We started by analyzing temporal changes in the birth locations of couples in our cohort. Prior to the Industrial Revolution (<1750), most marriages occurred between peo-ple born only 10km from each other (Fig. 4A [black line]). Similar patterns were found when analyzing European-born individuals (fig. S18) or North American-born individuals (fig. S19). After the beginning of the second Industrial Revolution (1870), the marital radius rapidly increased and reached ~100km for most marriages in the birth cohort in 1950. Next, we analyzed the genetic relatedness (IBD) of couples as measured by tracing their genealogical ties (Fig. 4C). Between 1650 and 1850, the average IBD of couples was relatively stable and on the order of ~4th cousins, whereas IBD exhibited a rapid decrease post-1850. Overall, the medi-an marital radius for each year showed a strong correlation (R2 = 72%) with the expected IBD between couples. Every 70km increase in the marital radius correlated with a decrease in the genetic relatedness of couples by one meiosis event (Fig. 4D). This correlation matches previous isolation by distance forces in continental regions (55). However, this trend was not consistent over time and exhibits three phases. For the pre-1800 birth cohorts, the correlation between marital distance and IBD was insignificant (p > 0.2) and weak (R2 = 0.7%) (fig. S20A). Couples born around 1800-1850 showed a two-fold increase in their marital distance from 8km in 1800 to 19km in 1850. Marriages are usually about 20-25 years after birth and around this time (1820-1875) rapid transportation changes took place, such as the advent of railroad travel in most of Europe and the United States. However, the increase in marital distance was significantly (p < 10−13) coupled with an increase in genetic relat-edness, contrary to the isolation by distance theory (fig. S20B). Only for the cohorts born after 1850, did the data match (R2 = 80%) the theoretical model of isolation by distance (fig. S20C). Taken together, the data shows a 50-year lag between the advent of increased familial dispersion and the decline of genetic relatedness between couples. During this time, individuals continued to marry relatives despite the increased distance. From these results, we hypothesize that changes in 19th century transportation were not the primary cause for decreased consanguinity. Rather, our results suggest that shifting cultural factors played a more important role in the recent reduction of genetic relatedness of couples in Western societies.
EDIT 3/2/2018: Added details of the article.
See also:
- Genetic vs. genealogical ancestors and actual geographical constraints
- We are all special, which also means that none of us is
- Y-DNA relevant in the postgenomic era, mtDNA study of Iron Age Italic population, and reconstructing the genetic history of Italians
- Analysis of R1b-DF27 haplogroups in modern populations adds new information that contrasts with ‘steppe admixture’ results