Interesting poster from SMBE 2017, Maps of effective migration as a summary of global human genetic diversity, by Benjamin Peter, Desislava Petkova, Matthew Stephens & John Novembre, of the JNPopGen group of the University of Chicago.
How well is human genetic diversity explained by this pure isolation-by-distance model?
How does the explanatory performance of EEMS compare to PCA?
Method: It uses the method proposed by Petkova et al. (2016) to fit a map of time-averaged (effective) migration rates to geographically referenced samples, and merges data from 24 different studies (8740 individuals from 469 populations) to assess human genetic diversity on global and continental scale.
Basic workflow:
Merge data, remove duplicated & related individuals.
Remove Hunter-Gatherer and recently admixed populations. Their locations are still indicated with (H) and (X), respectively
EEMS analysis
Calculate genetic distance matrix between all individuals.
Fit migration map to data using EEMS MCMC algorithm
Comparison to PCA: Standard PCA using flashpca (Abraham & Inouye 2014) was used, they compare correlation of genetic distance induced from first ten PCs with the fitted EEMS distance
Interpretation: A continuous habitat is approximated by a discrete grid (light gray). A Bayesian model is used to infer the most likely migration rates, which are given on a log scale compared to the Average (BLUE= 100x higher, BROWN=100x lower
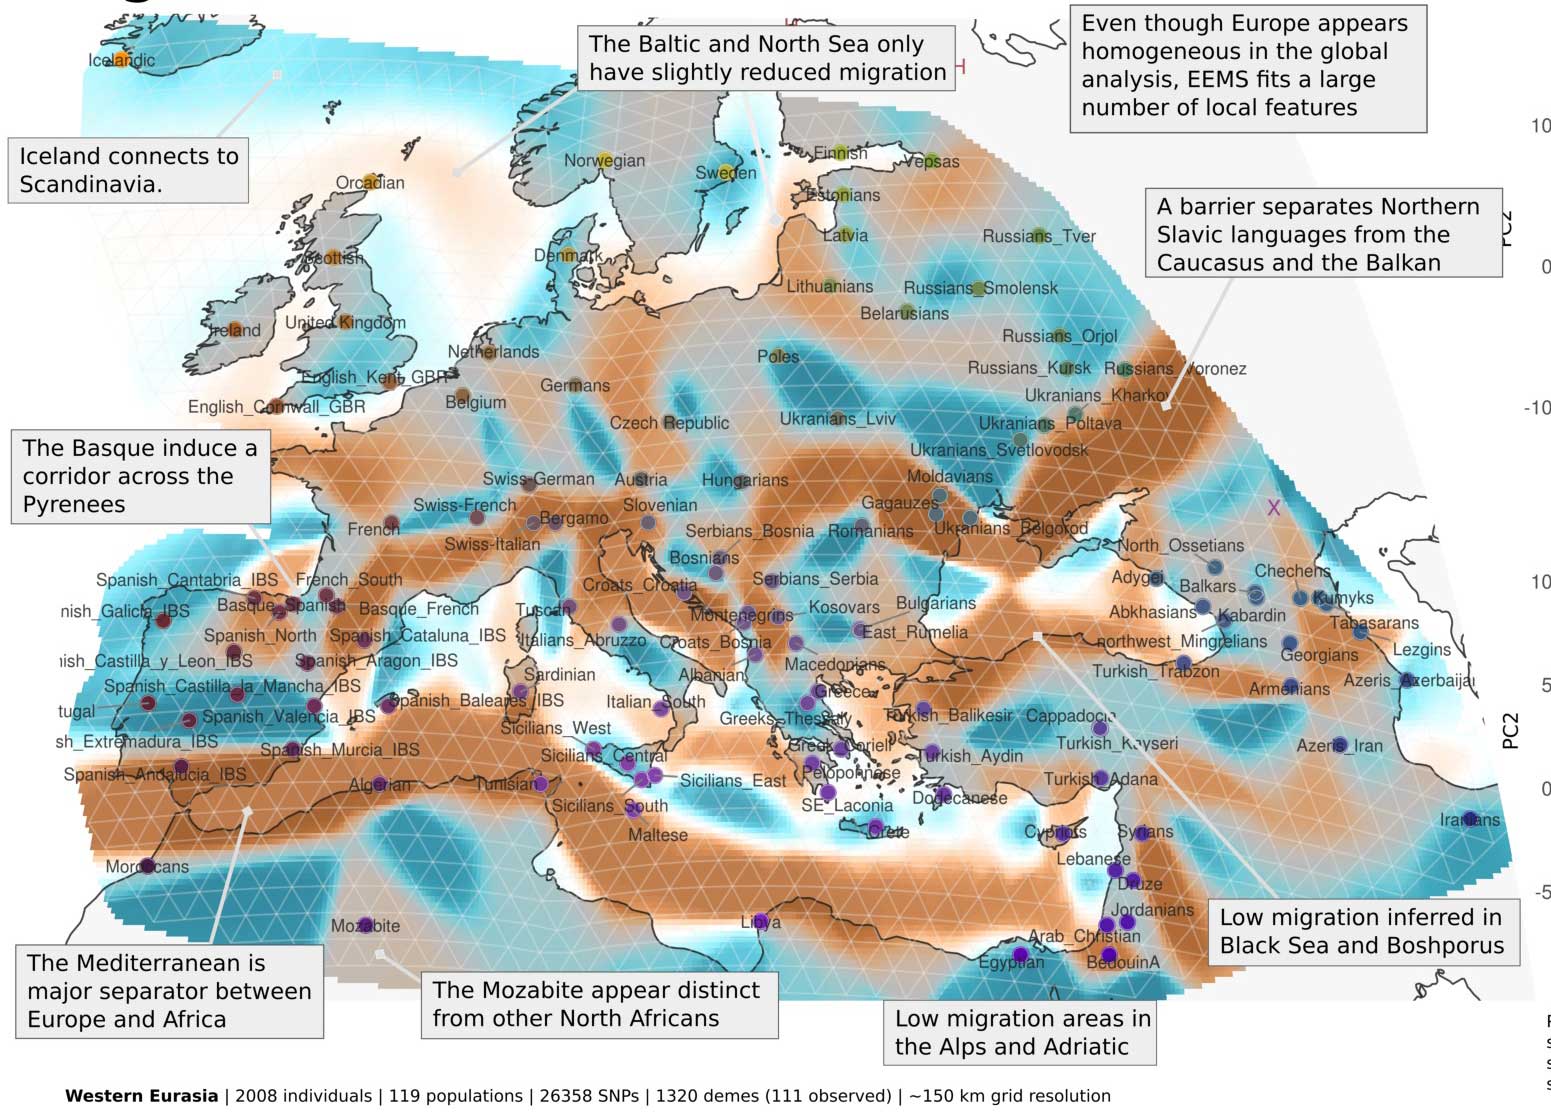
Map of effective migrations in Europe
Results (see maps):
Global diversity patterns correlate with topographical features
In Western Eurasia, EEMS reveals fine-scale migration surface features
Discussion: EEMS Maps are intuitive and direct way to visualize geographically referenced genetic data.
Dense sampling (WEstern Eurasian panel) in particular yields high resolution and accuracy, but the method works well at a global scale (FST=0.06) and just in Western Eurasia (FST=0.01).
EEMS-maps are able to reasonably well predict genetic differences, but hunter-gatherer populations and admixed populations were a priori excluded.
It is good practice to be registered
and logged in to comment.
Please keep the discussion of this post on topic. Civilized discussion. Academic tone.
For other topics, use the forums instead.